
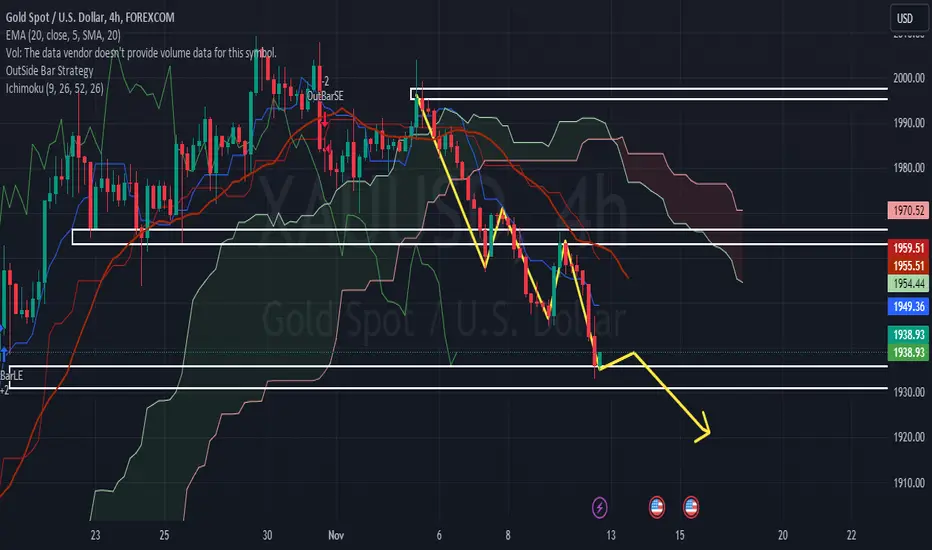
Gold prices continue their downward trend as the U.S. market opens, with XAU/USD trading at a new 4-week low near $1,940. Despite weak demand for the U.S. dollar, the precious metal is poised to end the week with a significant decline. The daily chart of XAU/USD indicates a bullish attempt as the pair aims to surpass the 23.6% Fibonacci retracement level of the rally from $1,810.41 to $1,909.34 at $1,962.20. While showing positive developments throughout the day, it also forms lower highs and lower lows, trading below the 20-day Simple Moving Average (SMA). Technical indicators are slightly bullish but remain in neutral territory.
Looking ahead on the 4-hour chart, XAU/USD faces resistance around the descending 20-day SMA, dragging its trajectory below the flat 100-day SMA. A breakout beyond these indicators would encourage buyers and potentially yield higher profits throughout the day. Meanwhile, the technical indicators point upward within negative territory.
Support Levels: $1,945.20, $1,933.20, $1,923.10
Resistance Levels: $1,965.30, $1,978.30, $1,989.00
Looking ahead on the 4-hour chart, XAU/USD faces resistance around the descending 20-day SMA, dragging its trajectory below the flat 100-day SMA. A breakout beyond these indicators would encourage buyers and potentially yield higher profits throughout the day. Meanwhile, the technical indicators point upward within negative territory.
Support Levels: $1,945.20, $1,933.20, $1,923.10
Resistance Levels: $1,965.30, $1,978.30, $1,989.00

관련 발행물
면책사항
해당 정보와 게시물은 금융, 투자, 트레이딩 또는 기타 유형의 조언이나 권장 사항으로 간주되지 않으며, 트레이딩뷰에서 제공하거나 보증하는 것이 아닙니다. 자세한 내용은 이용 약관을 참조하세요.
관련 발행물
면책사항
해당 정보와 게시물은 금융, 투자, 트레이딩 또는 기타 유형의 조언이나 권장 사항으로 간주되지 않으며, 트레이딩뷰에서 제공하거나 보증하는 것이 아닙니다. 자세한 내용은 이용 약관을 참조하세요.