
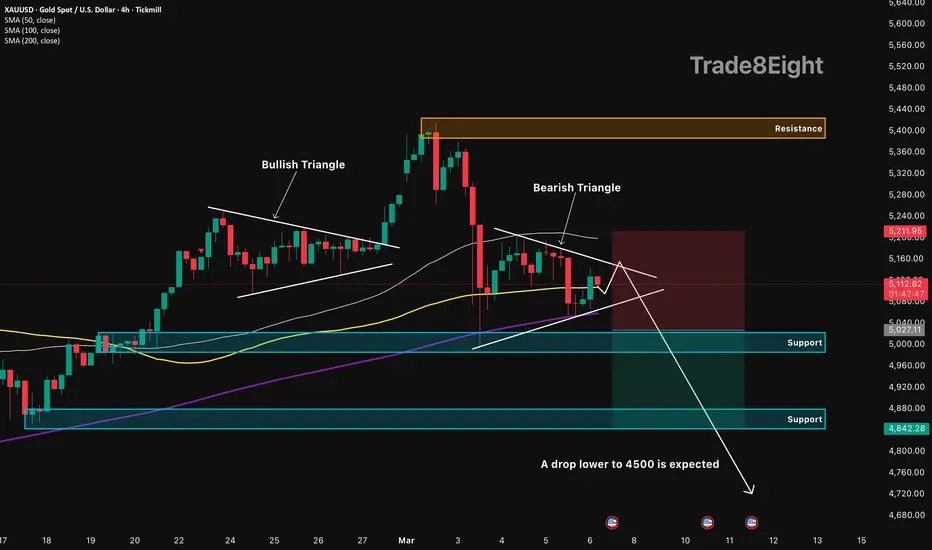
🛠 Technical Analysis: On the H4 chart, Gold (XAUUSD) has shifted from earlier bullish consolidation into a bearish triangle, signaling fading upside momentum after the sharp reversal from the highs. Price is compressing under the triangle’s descending top line while holding above the rising base, which often precedes a volatility expansion. The current structure is capped by the overhead supply area and the SMA 50, keeping rebounds vulnerable. The SMA 100 is near current price and acts as a short-term pivot, while the SMA 200 sits below as the next “reaction” zone if sellers push lower. A clean breakdown and hold below the 5,027 support would confirm the bearish triangle resolution and flip the base into resistance on retests. In that scenario, the next downside objective is the marked support at 4,842, with the chart also hinting at a deeper extension if panic selling accelerates.
———————————————
❗️Trade Parameters (SELL)
———————————————
➡️ Entry Point: 5,027.11
🎯 Take Profit: 4,842.28
🔴 Stop Loss: 5,211.95
⚠️ Disclaimer: This is a potential trade idea based on current analysis; market conditions and price direction are subject to change based on news factors and volatility.
———————————————
❗️Trade Parameters (SELL)
———————————————
➡️ Entry Point: 5,027.11
🎯 Take Profit: 4,842.28
🔴 Stop Loss: 5,211.95
⚠️ Disclaimer: This is a potential trade idea based on current analysis; market conditions and price direction are subject to change based on news factors and volatility.
노트
🌍 Fundamental Analysis: Gold is being pulled by two opposing safe-haven forces: escalating Middle East tensions can support XAU demand, but the US Dollar has also attracted haven flows, limiting gold’s upside and keeping pressure on rallies. Today’s US Nonfarm Payrolls (NFP) is the main volatility trigger: a stronger-than-expected report can lift yields and the USD, typically weighing on non-yielding gold and increasing the odds of a deeper pullback. Conversely, a weaker NFP print can weaken the Dollar and revive gold bids, potentially delaying the breakdown and driving a squeeze back into resistance.
⚠️ Public market view only. Not financial advice. DYOR and manage your own risk.
관련 발행물
면책사항
해당 정보와 게시물은 금융, 투자, 트레이딩 또는 기타 유형의 조언이나 권장 사항으로 간주되지 않으며, 트레이딩뷰에서 제공하거나 보증하는 것이 아닙니다. 자세한 내용은 이용 약관을 참조하세요.
⚠️ Public market view only. Not financial advice. DYOR and manage your own risk.
관련 발행물
면책사항
해당 정보와 게시물은 금융, 투자, 트레이딩 또는 기타 유형의 조언이나 권장 사항으로 간주되지 않으며, 트레이딩뷰에서 제공하거나 보증하는 것이 아닙니다. 자세한 내용은 이용 약관을 참조하세요.