
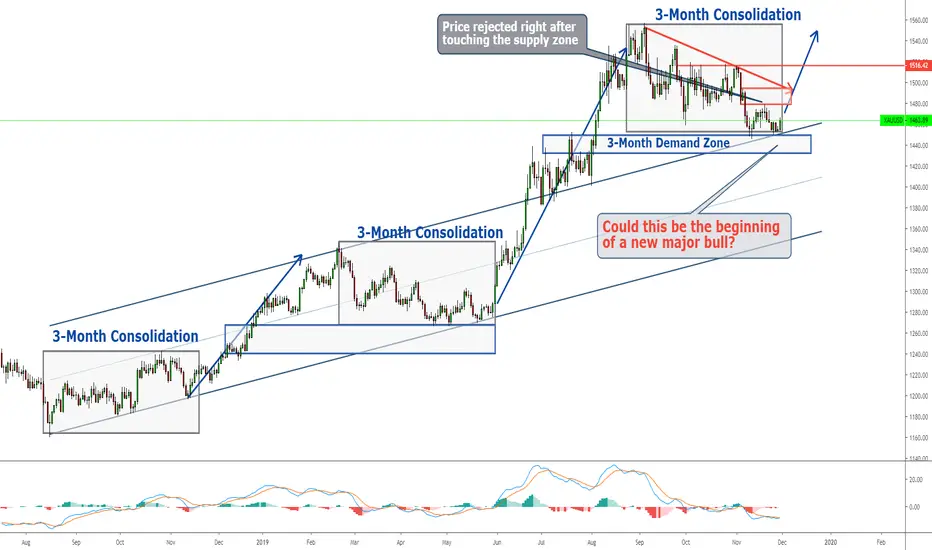
My chart plotting remains literally the same as the last weekly forecast.
Gold fell at the beginning of last week and ranged while forming lower highs.
The price was seen constantly rejected off from 1453.
Finally, last Friday, the gold price soared during the US session and breached the range high of 1462.
The bullish wave also broke above a falling channel in the H4 chart.
And as of current, the gold has completed 3 months of consolidation and will start to trend anytime soon.
Based on all these factors, the gold is technically in the first phase of a new bullish structure.
This week, we shall focus on 'buying the pullback' at 1462, 1460 and finally 1458.
Gold fell at the beginning of last week and ranged while forming lower highs.
The price was seen constantly rejected off from 1453.
Finally, last Friday, the gold price soared during the US session and breached the range high of 1462.
The bullish wave also broke above a falling channel in the H4 chart.
And as of current, the gold has completed 3 months of consolidation and will start to trend anytime soon.
Based on all these factors, the gold is technically in the first phase of a new bullish structure.
This week, we shall focus on 'buying the pullback' at 1462, 1460 and finally 1458.

관련 발행물
면책사항
해당 정보와 게시물은 금융, 투자, 트레이딩 또는 기타 유형의 조언이나 권장 사항으로 간주되지 않으며, 트레이딩뷰에서 제공하거나 보증하는 것이 아닙니다. 자세한 내용은 이용 약관을 참조하세요.
면책사항
해당 정보와 게시물은 금융, 투자, 트레이딩 또는 기타 유형의 조언이나 권장 사항으로 간주되지 않으며, 트레이딩뷰에서 제공하거나 보증하는 것이 아닙니다. 자세한 내용은 이용 약관을 참조하세요.