
Current Price: 4006.53
Trend: Short-term bearish
🔍 Chart Breakdown
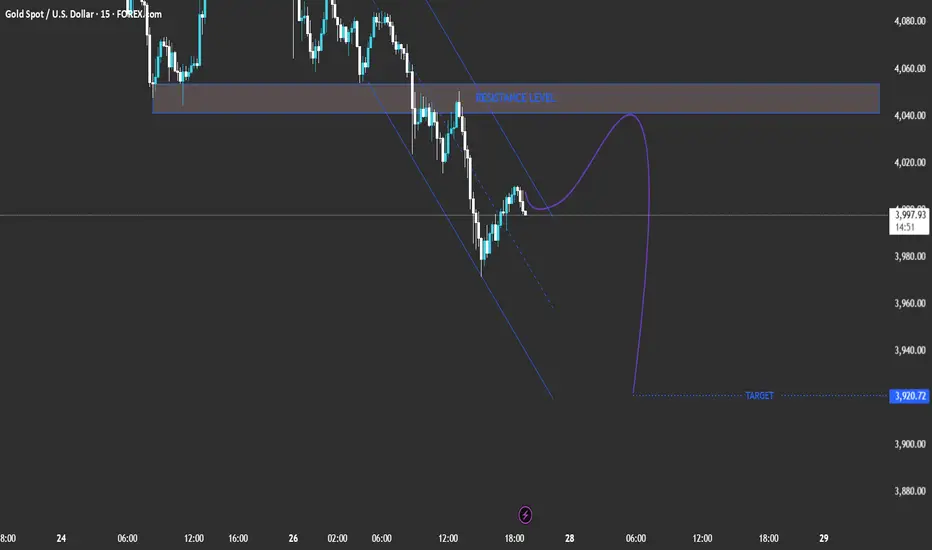
The price is moving within a descending channel, indicating a continuation of the bearish momentum.
There is a key resistance zone around 4035–4060, highlighted in the shaded area. This zone aligns with previous structure and upper trendline resistance.
The market is currently making a minor pullback toward this resistance area after touching the lower boundary of the descending channel.
📉 Expected Move
The purple projection suggests a pullback to the resistance zone, followed by a strong rejection downward.
The target level is set around 3920.72, which corresponds to a previous swing low and a possible completion of the bearish wave.
⚙️ Trading Outlook
Direction Entry Zone Stop Loss Take Profit Confirmation
Sell 4035–4060 4075 3920 Rejection candle or bearish engulfing at resistance
📊 Summary
Gold remains in a short-term downtrend, and the best opportunity is to wait for price to test resistance (4035–4060) before considering short positions targeting 3920.
A breakout above 4075 would invalidate this bearish setup and could signal a potential trend reversal. CA1! MC1!
  SN1!
SN1!  LH1!
LH1!  SC1!
SC1!  AH1!
AH1!  CO1!
CO1!  ZS1!
ZS1!  PB1! HC1! AA1! EA1! ST1! AN1! AW1!
Trend: Short-term bearish
🔍 Chart Breakdown
The price is moving within a descending channel, indicating a continuation of the bearish momentum.
There is a key resistance zone around 4035–4060, highlighted in the shaded area. This zone aligns with previous structure and upper trendline resistance.
The market is currently making a minor pullback toward this resistance area after touching the lower boundary of the descending channel.
📉 Expected Move
The purple projection suggests a pullback to the resistance zone, followed by a strong rejection downward.
The target level is set around 3920.72, which corresponds to a previous swing low and a possible completion of the bearish wave.
⚙️ Trading Outlook
Direction Entry Zone Stop Loss Take Profit Confirmation
Sell 4035–4060 4075 3920 Rejection candle or bearish engulfing at resistance
📊 Summary
Gold remains in a short-term downtrend, and the best opportunity is to wait for price to test resistance (4035–4060) before considering short positions targeting 3920.
A breakout above 4075 would invalidate this bearish setup and could signal a potential trend reversal.
CA1! MC1! SN1! LH1! SC1! AH1! CO1! ZS1! PB1! HC1! AA1! EA1! ST1! AN1! AW1! 액티브 트레이드
거래청산: 타겟 닿음

면책사항
해당 정보와 게시물은 금융, 투자, 트레이딩 또는 기타 유형의 조언이나 권장 사항으로 간주되지 않으며, 트레이딩뷰에서 제공하거나 보증하는 것이 아닙니다. 자세한 내용은 이용 약관을 참조하세요.
면책사항
해당 정보와 게시물은 금융, 투자, 트레이딩 또는 기타 유형의 조언이나 권장 사항으로 간주되지 않으며, 트레이딩뷰에서 제공하거나 보증하는 것이 아닙니다. 자세한 내용은 이용 약관을 참조하세요.