
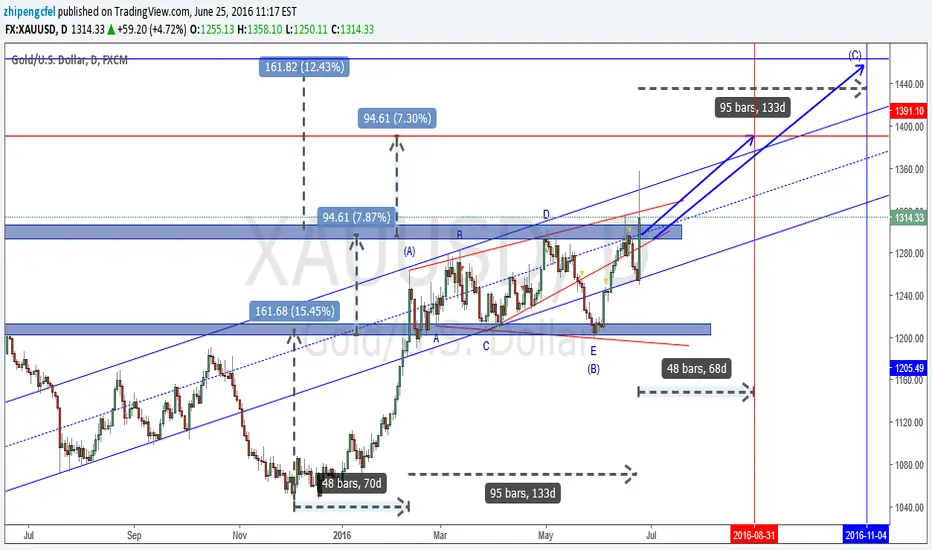
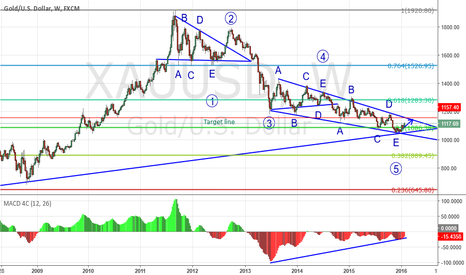
Gold was bottomed at December 3rd last year and was confirmed at December 17th with a double bottom. I made an elliott wave analysis previously and pointed that the five waves down were finished and would start a three waves correction.
From elliott wave analysis the wave A correction has raised from 1046.23 to 1263.37 with 70 days. Then it underwent an expanding triangle correction for 109 days which is wave B. It broke out of the correction region at Friday. If this breakthrough is confirmed in the following week, gold will head for higher.
I made a timemode analysis based on Tim West and IVAN Labrie's method.
Price target:
TP1: 1391
TP2: 1463
Time target:
T1: August 31th
T2: November 04th
Good luck for everyone!
Notes: Pay attention to whether the breakthrough will be confirmed in the following week. If it does, gold is in wave C.
From elliott wave analysis the wave A correction has raised from 1046.23 to 1263.37 with 70 days. Then it underwent an expanding triangle correction for 109 days which is wave B. It broke out of the correction region at Friday. If this breakthrough is confirmed in the following week, gold will head for higher.
I made a timemode analysis based on Tim West and IVAN Labrie's method.
Price target:
TP1: 1391
TP2: 1463
Time target:
T1: August 31th
T2: November 04th
Good luck for everyone!
Notes: Pay attention to whether the breakthrough will be confirmed in the following week. If it does, gold is in wave C.
노트
Gold got supporeted from previous choppy area. The breakthrough was confirmed!노트
The bull looks good so far. 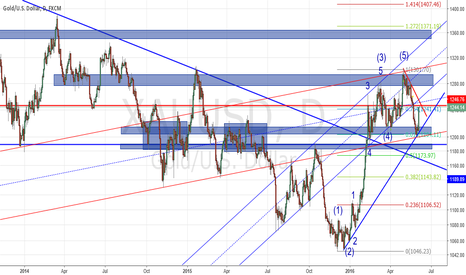
노트
The bull is good so far. Break out of the bull flag.노트
It seems that price retested the expanding triangle and got supported from the red line. It is a good opportunity to join the long again.The price has broken out of the bull flag.
Good luck for everyone!

관련 발행물
면책사항
해당 정보와 게시물은 금융, 투자, 트레이딩 또는 기타 유형의 조언이나 권장 사항으로 간주되지 않으며, 트레이딩뷰에서 제공하거나 보증하는 것이 아닙니다. 자세한 내용은 이용 약관을 참조하세요.
관련 발행물
면책사항
해당 정보와 게시물은 금융, 투자, 트레이딩 또는 기타 유형의 조언이나 권장 사항으로 간주되지 않으며, 트레이딩뷰에서 제공하거나 보증하는 것이 아닙니다. 자세한 내용은 이용 약관을 참조하세요.