
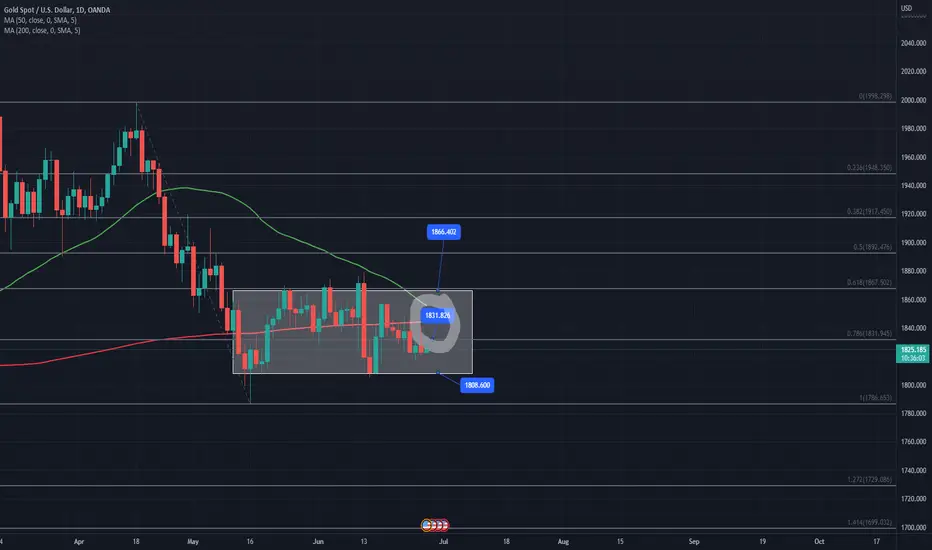
50 MA --> 🟢
200 MA --> 🔴
What is Death Cross ?
The death cross is a chart pattern that signals a growing weakness in an asset's price. It comprises two separate lines called “moving averages.” Each moving average line (MA) is formed by calculating the average price over a certain period of time and using those points to create a smoothed line.
An example of a death cross is circled in gray.
If you want to see indicator signals:
Median : Sell
Parabolic SAR : Sell
SuperTrend : Sell
Awesome Ossillator : Sell
Williams Alligator : Sell
Support Level :
🛑1805-1810
Resistance Level :
🎯1830
🎯1865
Not Financial Advice
200 MA --> 🔴
What is Death Cross ?
The death cross is a chart pattern that signals a growing weakness in an asset's price. It comprises two separate lines called “moving averages.” Each moving average line (MA) is formed by calculating the average price over a certain period of time and using those points to create a smoothed line.
An example of a death cross is circled in gray.
If you want to see indicator signals:
Median : Sell
Parabolic SAR : Sell
SuperTrend : Sell
Awesome Ossillator : Sell
Williams Alligator : Sell
Support Level :
🛑1805-1810
Resistance Level :
🎯1830
🎯1865
Not Financial Advice

면책사항
해당 정보와 게시물은 금융, 투자, 트레이딩 또는 기타 유형의 조언이나 권장 사항으로 간주되지 않으며, 트레이딩뷰에서 제공하거나 보증하는 것이 아닙니다. 자세한 내용은 이용 약관을 참조하세요.
면책사항
해당 정보와 게시물은 금융, 투자, 트레이딩 또는 기타 유형의 조언이나 권장 사항으로 간주되지 않으며, 트레이딩뷰에서 제공하거나 보증하는 것이 아닙니다. 자세한 내용은 이용 약관을 참조하세요.