
◆ Market Context
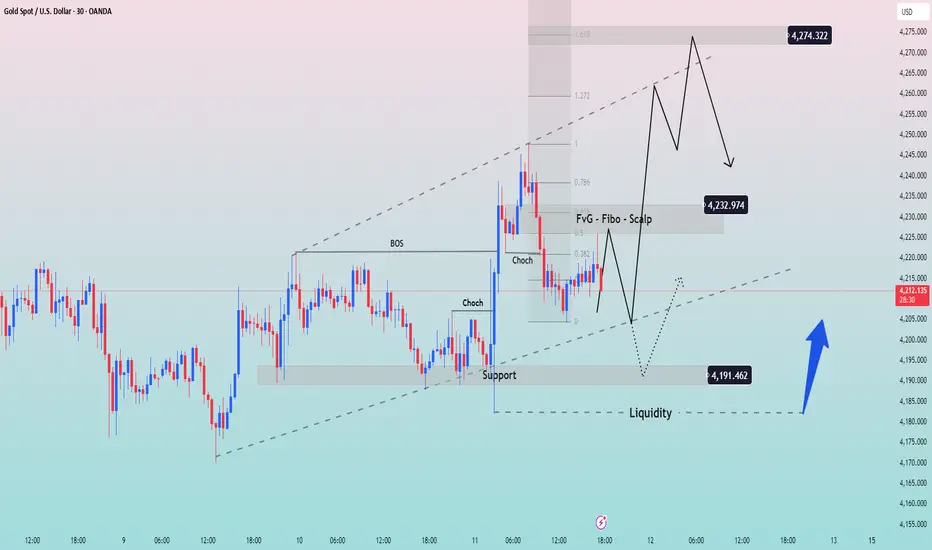
After breaking a bullish BOS, Gold pushed strongly toward 4,232 before losing momentum. Subsequent pullbacks formed a bearish CHoCH, signalling that the corrective wave is weakening and the market needs rebalancing before choosing its next direction.
Price is now sitting inside the short-term ascending channel, near the FVG – Fibo – Scalp zone where strong reactions typically occur.
◆ SMC & Price Action
• The 4,191 support remains a key structural low where strong buying previously broke BOS.
• The FVG around 4,232 is an area where sellers may react since it was created during the fast drop.
• The ascending trendline is still supporting price, but if it breaks, liquidity below 4,191 may be swept before any recovery.
◆ Main Trading Scenarios
➤ Scenario 1: Price rejects the 4,232 FVG → Short-term Sell bias
• Conditions: rejection candle / weakness pattern at 4,230–4,233
• Targets:
▪ 4,210
▪ 4,191 (strong support)
➤ Scenario 2: Price breaks through FVG and extends into Fibo expansion → Look for Sell signals
• Fibo extension targets: 4,255–4,274
• Look for reversal signals to Sell in line with the larger trend.
➤ Scenario 3: Buy from support if liquidity is swept
• Ideal Buy zone: 4,191 → liquidity below 4,185
• Conditions: strong reaction or bullish CHoCH
• Targets:
▪ 4,215
▪ 4,232 (FVG)
◆ Summary
• FVG 4,232 is the key area for short-term trend direction.
• Sell-the-reaction at the FVG remains high-probability.
• If price returns to 4,191 support and holds → potential for a strong Buy.
• If support breaks, market may sweep deeper liquidity before forming a new low.
After breaking a bullish BOS, Gold pushed strongly toward 4,232 before losing momentum. Subsequent pullbacks formed a bearish CHoCH, signalling that the corrective wave is weakening and the market needs rebalancing before choosing its next direction.
Price is now sitting inside the short-term ascending channel, near the FVG – Fibo – Scalp zone where strong reactions typically occur.
◆ SMC & Price Action
• The 4,191 support remains a key structural low where strong buying previously broke BOS.
• The FVG around 4,232 is an area where sellers may react since it was created during the fast drop.
• The ascending trendline is still supporting price, but if it breaks, liquidity below 4,191 may be swept before any recovery.
◆ Main Trading Scenarios
➤ Scenario 1: Price rejects the 4,232 FVG → Short-term Sell bias
• Conditions: rejection candle / weakness pattern at 4,230–4,233
• Targets:
▪ 4,210
▪ 4,191 (strong support)
➤ Scenario 2: Price breaks through FVG and extends into Fibo expansion → Look for Sell signals
• Fibo extension targets: 4,255–4,274
• Look for reversal signals to Sell in line with the larger trend.
➤ Scenario 3: Buy from support if liquidity is swept
• Ideal Buy zone: 4,191 → liquidity below 4,185
• Conditions: strong reaction or bullish CHoCH
• Targets:
▪ 4,215
▪ 4,232 (FVG)
◆ Summary
• FVG 4,232 is the key area for short-term trend direction.
• Sell-the-reaction at the FVG remains high-probability.
• If price returns to 4,191 support and holds → potential for a strong Buy.
• If support breaks, market may sweep deeper liquidity before forming a new low.

Join Community Gold BMR_MasteTrade:
t.me/+p2iJeq3yBUYyNDJl
t.me/+p2iJeq3yBUYyNDJl
면책사항
해당 정보와 게시물은 금융, 투자, 트레이딩 또는 기타 유형의 조언이나 권장 사항으로 간주되지 않으며, 트레이딩뷰에서 제공하거나 보증하는 것이 아닙니다. 자세한 내용은 이용 약관을 참조하세요.
Join Community Gold BMR_MasteTrade:
t.me/+p2iJeq3yBUYyNDJl
t.me/+p2iJeq3yBUYyNDJl
면책사항
해당 정보와 게시물은 금융, 투자, 트레이딩 또는 기타 유형의 조언이나 권장 사항으로 간주되지 않으며, 트레이딩뷰에서 제공하거나 보증하는 것이 아닙니다. 자세한 내용은 이용 약관을 참조하세요.