
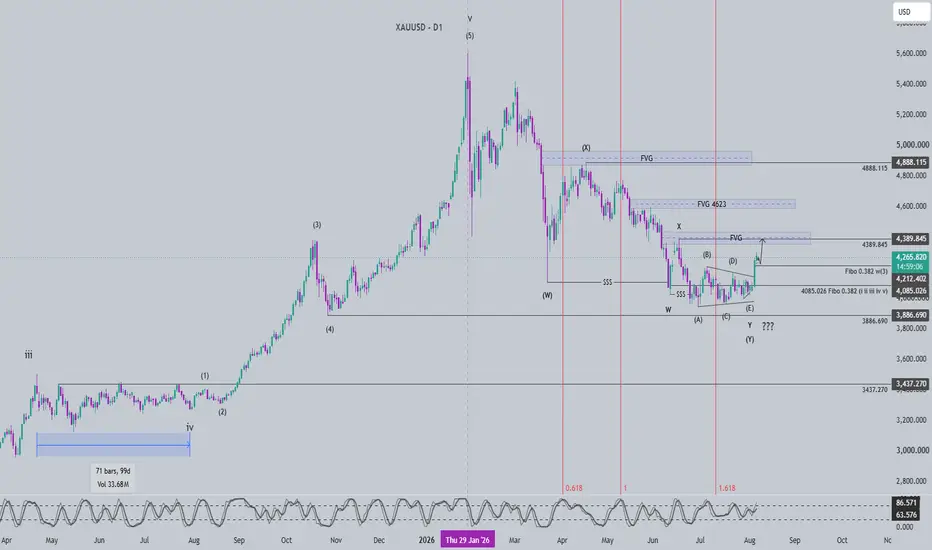
Let us examine the D1 timeframe to gain a broader view of the long-term market structure.
D1 Timeframe
From a time perspective, XAUUSD has been developing a major corrective move since January 29, 2026. Compared with the previous wave 4, the current correction has now lasted approximately 1.618 times as long as the previous wave 4. This is an important timing milestone and also satisfies the time requirement for a wave within a larger-degree structure.
According to Elliott Wave characteristics, a corrective wave often ends within the price territory of wave 4 of the previous smaller-degree structure. On the D1 timeframe, we can identify two previous wave 4 price zones, located around 3,886 and 3,437. Price is currently trading within the 3,886 zone.
Price has also reached the 0.382 Fibonacci retracement level of the complete five-wave structure consisting of waves (i), (ii), (iii), (iv), and (v). This five-wave structure forms wave 3 of a larger degree. Therefore, the 0.382 Fibonacci level is often a potential area where wave 4 may end.
Based on these conditions, yesterday’s strong bullish breakout candle may represent an early signal that a new trend is beginning. However, we cannot confirm this conclusion yet and must wait for further confirmation to develop gradually.
If the current rally continues to create multiple FVGs, sequentially sweeps the highs above, and then does not form any lower lows, this would be a characteristic of a new bullish trend supported by institutional order flow.
Looking at the final decline, we can see that the lows of wave (W) and wave W have both been swept. The liquidity below these lows consisted of stop-loss orders from early buyers and pending sell orders from breakout traders. This is considered external liquidity.
One important principle is that after price takes external liquidity, it often returns to rebalance the internal imbalances, particularly the FVGs within the structure.
Therefore, our initial expectation is that price may move toward and rebalance one of the two FVG zones located around 4,389 and 4,623. After price rebalances one of these areas and forms a corrective move, the subsequent price action will provide the basis for identifying and confirming the developing wave structure.
A daily close above 4,888 would be a very strong signal confirming that a new bullish trend has begun.
액티브 트레이드
H1 Timeframe Update
A five-wave bullish structure is currently developing. Price may now be approaching the end of wave (3) and preparing to enter wave (4).
During the advance, price moved strongly and created multiple FVGs along the way. This price action suggests that the recent upward move is wave (3).
The 0.382 Fibonacci retracement level of wave (3) is located around 4212. This level also lies within the FVG below, which may act as a price magnet and potentially become the target area where wave (4) ends.
Wave (4) often develops as a sideways correction consisting of several smaller waves. Therefore, the current corrective move is likely to continue.
The target for wave (5) is located around 4389. This level also lies within an FVG on a higher timeframe.
Trading Plan: Look for Buy opportunities within the FVG that aligns with the 0.382 Fibonacci retracement level of wave (3).
거래청산: 타겟 닿음
노트

📢 Sometimes signals appear on TradingView with a slight delay!
🚀 Join our Telegram channel to get instant updates and real-time scalping signals:
👉 t.me/+lASNLyXKqcFiYmJl
🚀 Join our Telegram channel to get instant updates and real-time scalping signals:
👉 t.me/+lASNLyXKqcFiYmJl
관련 발행물
면책사항
해당 정보와 게시물은 금융, 투자, 트레이딩 또는 기타 유형의 조언이나 권장 사항으로 간주되지 않으며, 트레이딩뷰에서 제공하거나 보증하는 것이 아닙니다. 자세한 내용은 이용 약관을 참조하세요.
📢 Sometimes signals appear on TradingView with a slight delay!
🚀 Join our Telegram channel to get instant updates and real-time scalping signals:
👉 t.me/+lASNLyXKqcFiYmJl
🚀 Join our Telegram channel to get instant updates and real-time scalping signals:
👉 t.me/+lASNLyXKqcFiYmJl
관련 발행물
면책사항
해당 정보와 게시물은 금융, 투자, 트레이딩 또는 기타 유형의 조언이나 권장 사항으로 간주되지 않으며, 트레이딩뷰에서 제공하거나 보증하는 것이 아닙니다. 자세한 내용은 이용 약관을 참조하세요.