
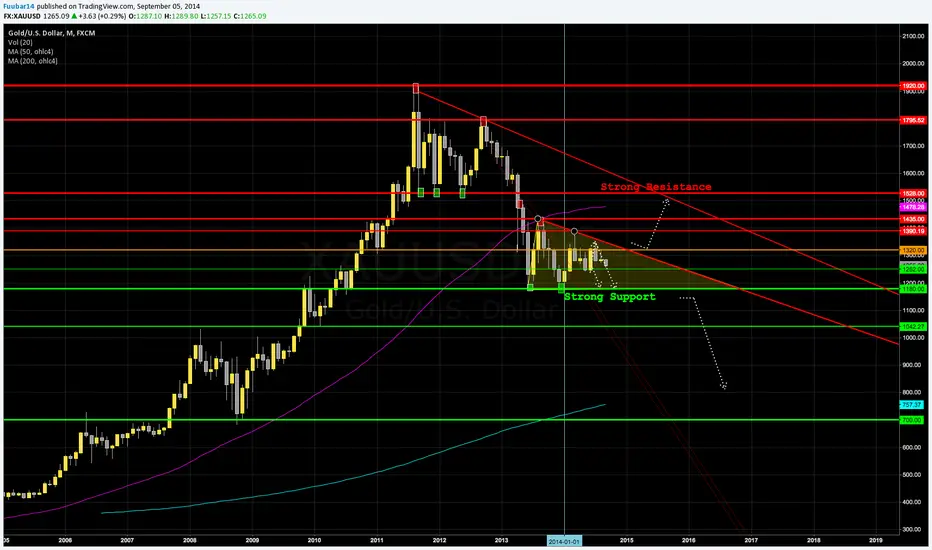
Looking at the monthly chart we see a strong support at 1180 USD forming the lower side of the descending triangle with the downwards trend line on top.
If the support at 1040 USD falls, lower targets get activated. 1042 could be a short stop an its way down to levels around 800 USD or even more likely 700 USD.
If price breaks through the upper trend line, higher targets would be activated and some resistance levels must be passed to reach the stronger resistance at 1528 USD.
If the support at 1040 USD falls, lower targets get activated. 1042 could be a short stop an its way down to levels around 800 USD or even more likely 700 USD.
If price breaks through the upper trend line, higher targets would be activated and some resistance levels must be passed to reach the stronger resistance at 1528 USD.

면책사항
해당 정보와 게시물은 금융, 투자, 트레이딩 또는 기타 유형의 조언이나 권장 사항으로 간주되지 않으며, 트레이딩뷰에서 제공하거나 보증하는 것이 아닙니다. 자세한 내용은 이용 약관을 참조하세요.
면책사항
해당 정보와 게시물은 금융, 투자, 트레이딩 또는 기타 유형의 조언이나 권장 사항으로 간주되지 않으며, 트레이딩뷰에서 제공하거나 보증하는 것이 아닙니다. 자세한 내용은 이용 약관을 참조하세요.