
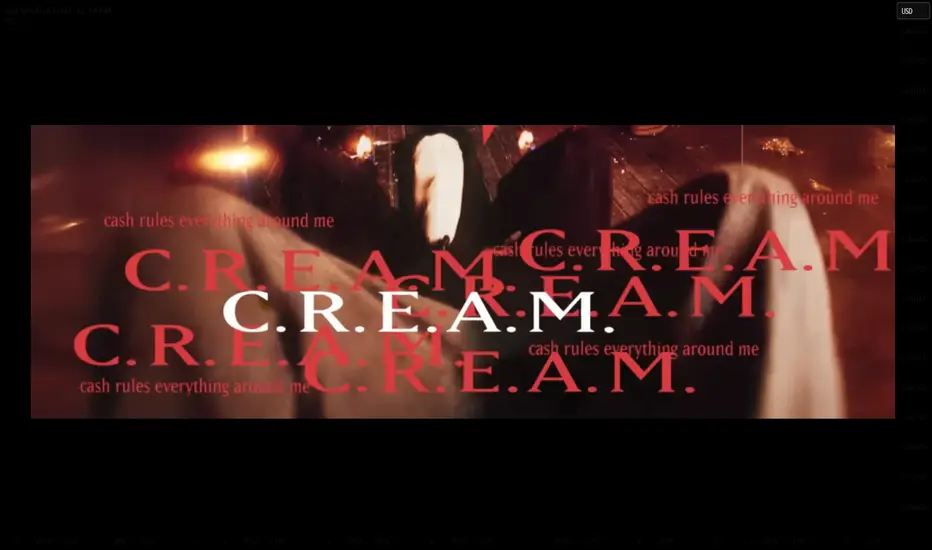
Wu-Tang Clan got it right: cash rules everything in financial markets too.
If you understand anything about trading, at some point you reached the conclusion that EVERYTHING that is not related to risk, reward, fear and greed is secondary.
Moving averages? Doesn't matter.
Super trend lines? Doesn't matter.
RSI? Doesn't matter.
Lunar cycles? Don't matter.
The latest news from X company's lawsuit? Doesn't matter.
The magnificent head-and-shoulders formation? Doesn't matter.
The liquidity raids and stop hunts from evil market makers? Neither.
EVERYTHING moves based on money, based on fear and greed.
The best indicator on a chart is who is winning, who is losing, and by how much.
This is literally what produces what we call "support and resistance." Support and resistance is not the typical horizontal or diagonal line curve-fitted to collect as many touches as possible. In more general terms, it is nothing more and nothing less than price bouncing back and forth: buys and sells.
When someone buys and creates "support" (an institution, for example) a relationship with their potential gain and loss is automatically activated for that participant.
If you believe that participant is going to take profits because price reached your retail stop of 0.00001 lots, let me tell you: you're dreaming. It happens circumstantially, no doubt, but not as the main driver of their activity. At that level of activity there can be dozens of reasons to take profits, exit the position, and create "resistance", but the one that commands everything will always be fear and greed. Fear of losing potential gains if price reverses, greed to lock in those gains and collect a fat year-end bonus.
That's when everything fails. No line or indicator can withstand the practical reality of fear and greed, of gains and losses. At best, each tool is a mathematical projection of something that might happen, but one that goes completely out the window when whoever generated the support/resistance follows absolutely none of those projections.
Let's think for a second: what institutions or large participants actually have charts with the tools we use? If we take the full universe and find that between 1 and 5% do, we're lucky. In general, institutions are some combination of macro investing, high-frequency trading, statistical models, and value investing. There really isn't anyone going to Wall Street to draw "fair value gaps" on a chart.
That doesn't mean the tool is useless, because its premise is to capture through a projection the potential future action of some participant. So it has nothing to do with whether that participant uses it or not, but with the action itself: whether it captures it or not. But that economic action, whoever carries it out, has one single common denominator: gains and losses, fear and greed. That makes every tool and indicator secondary.
Practical conclusion: learn to measure who is winning or losing and by how much. Risk-to-reward is not just a little number that enters a formula to spit out an expected value. It is the most reliable indicator of all, because it is genuinely what drives the actions of people who know what they're doing and move real money.
____________________________________________________________________
Let's look at a concrete example.
Suppose we build a basic market structure framework where we have support and resistance. We buy at support and sell at resistance. The risk sits beyond that level.
Sometimes it's hard to find an A+ opportunity and we have to wait hours or days for one. Why? Because everything has to line up perfectly before entering. The potential gain has to be sufficient to justify the risk, otherwise it's not worth taking. Now we come across a "strange" day where the potential gain is enormous: 8 or 10 times what the typical framework allows us to risk. You should automatically be suspicious of this setup.
One possible error is that the stop is poorly measured relative to the magnitude of the current swings, meaning it's too small relative to the structure and therefore skewed. The risk there is that the slightest noise will take you out of the position.
Another case might be that this simply is the correctly calculated, real potential gain of the setup. That's where the problem begins.
You'll notice that to truly extract it, you'll have to endure an amount of turbulence and fluctuation, because in general, the moment participants are sitting at 1:1, 2:1, 3:1 on their risk, they'll start taking profits, producing "resistance" against your trade. At that point everything starts to break down, and no statistic can hold up against the practical reality of the moment.
The point is simple: "price action" is not merely a collection of patterns like the "engulfing-candle-shooting-star-morning-star-reversal" at the wedge low. It is literally what the rest of the traders are doing, and they will always make their decisions based on potential gains and losses, fear and greed.
That's also why, as they rightly say, the best trades are the hardest ones, because those are the ones where everything looks like it's falling apart, but it's precisely the moment when someone is willing to drop a bomb into the market because the numbers line up perfectly.
Once there's "confirmation", that participant is already in and winning. Now the trade is easier, but you're trading one step behind them, and when they dump everything it's going to hit you in the face if you entered too late and too far back.
At that point it doesn't matter where the line or the indicator is. What matters most is where the trade was taken, where the setup was born, and who got in first, because from that point on, everything will start to unfold.
If you understand anything about trading, at some point you reached the conclusion that EVERYTHING that is not related to risk, reward, fear and greed is secondary.
Moving averages? Doesn't matter.
Super trend lines? Doesn't matter.
RSI? Doesn't matter.
Lunar cycles? Don't matter.
The latest news from X company's lawsuit? Doesn't matter.
The magnificent head-and-shoulders formation? Doesn't matter.
The liquidity raids and stop hunts from evil market makers? Neither.
EVERYTHING moves based on money, based on fear and greed.
The best indicator on a chart is who is winning, who is losing, and by how much.
This is literally what produces what we call "support and resistance." Support and resistance is not the typical horizontal or diagonal line curve-fitted to collect as many touches as possible. In more general terms, it is nothing more and nothing less than price bouncing back and forth: buys and sells.
When someone buys and creates "support" (an institution, for example) a relationship with their potential gain and loss is automatically activated for that participant.
If you believe that participant is going to take profits because price reached your retail stop of 0.00001 lots, let me tell you: you're dreaming. It happens circumstantially, no doubt, but not as the main driver of their activity. At that level of activity there can be dozens of reasons to take profits, exit the position, and create "resistance", but the one that commands everything will always be fear and greed. Fear of losing potential gains if price reverses, greed to lock in those gains and collect a fat year-end bonus.
That's when everything fails. No line or indicator can withstand the practical reality of fear and greed, of gains and losses. At best, each tool is a mathematical projection of something that might happen, but one that goes completely out the window when whoever generated the support/resistance follows absolutely none of those projections.
Let's think for a second: what institutions or large participants actually have charts with the tools we use? If we take the full universe and find that between 1 and 5% do, we're lucky. In general, institutions are some combination of macro investing, high-frequency trading, statistical models, and value investing. There really isn't anyone going to Wall Street to draw "fair value gaps" on a chart.
That doesn't mean the tool is useless, because its premise is to capture through a projection the potential future action of some participant. So it has nothing to do with whether that participant uses it or not, but with the action itself: whether it captures it or not. But that economic action, whoever carries it out, has one single common denominator: gains and losses, fear and greed. That makes every tool and indicator secondary.
Practical conclusion: learn to measure who is winning or losing and by how much. Risk-to-reward is not just a little number that enters a formula to spit out an expected value. It is the most reliable indicator of all, because it is genuinely what drives the actions of people who know what they're doing and move real money.
____________________________________________________________________
Let's look at a concrete example.
Suppose we build a basic market structure framework where we have support and resistance. We buy at support and sell at resistance. The risk sits beyond that level.
Sometimes it's hard to find an A+ opportunity and we have to wait hours or days for one. Why? Because everything has to line up perfectly before entering. The potential gain has to be sufficient to justify the risk, otherwise it's not worth taking. Now we come across a "strange" day where the potential gain is enormous: 8 or 10 times what the typical framework allows us to risk. You should automatically be suspicious of this setup.
One possible error is that the stop is poorly measured relative to the magnitude of the current swings, meaning it's too small relative to the structure and therefore skewed. The risk there is that the slightest noise will take you out of the position.
Another case might be that this simply is the correctly calculated, real potential gain of the setup. That's where the problem begins.
You'll notice that to truly extract it, you'll have to endure an amount of turbulence and fluctuation, because in general, the moment participants are sitting at 1:1, 2:1, 3:1 on their risk, they'll start taking profits, producing "resistance" against your trade. At that point everything starts to break down, and no statistic can hold up against the practical reality of the moment.
The point is simple: "price action" is not merely a collection of patterns like the "engulfing-candle-shooting-star-morning-star-reversal" at the wedge low. It is literally what the rest of the traders are doing, and they will always make their decisions based on potential gains and losses, fear and greed.
That's also why, as they rightly say, the best trades are the hardest ones, because those are the ones where everything looks like it's falling apart, but it's precisely the moment when someone is willing to drop a bomb into the market because the numbers line up perfectly.
Once there's "confirmation", that participant is already in and winning. Now the trade is easier, but you're trading one step behind them, and when they dump everything it's going to hit you in the face if you entered too late and too far back.
At that point it doesn't matter where the line or the indicator is. What matters most is where the trade was taken, where the setup was born, and who got in first, because from that point on, everything will start to unfold.

면책사항
해당 정보와 게시물은 금융, 투자, 트레이딩 또는 기타 유형의 조언이나 권장 사항으로 간주되지 않으며, 트레이딩뷰에서 제공하거나 보증하는 것이 아닙니다. 자세한 내용은 이용 약관을 참조하세요.
면책사항
해당 정보와 게시물은 금융, 투자, 트레이딩 또는 기타 유형의 조언이나 권장 사항으로 간주되지 않으며, 트레이딩뷰에서 제공하거나 보증하는 것이 아닙니다. 자세한 내용은 이용 약관을 참조하세요.