
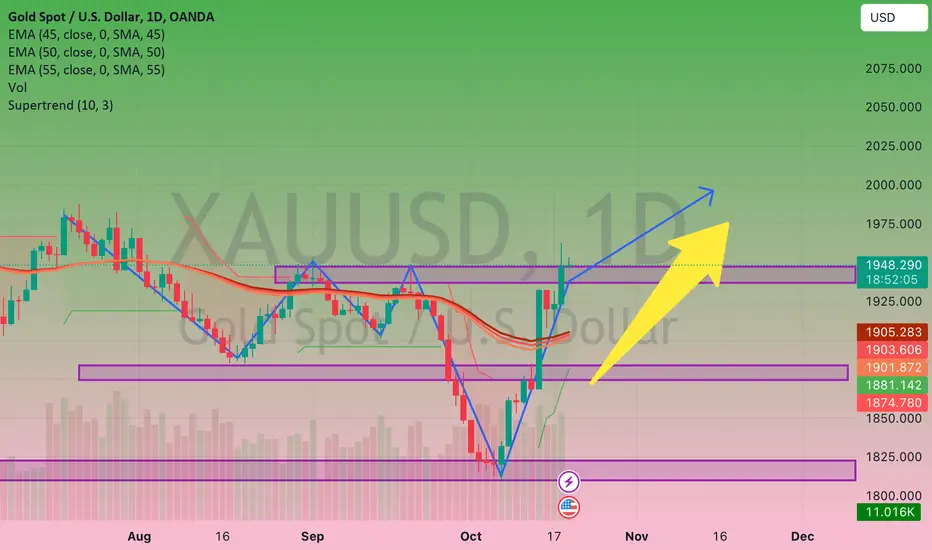
Gold prices hover around $1,950 after retreating from the two-month high of $1,962 in early Asian trading on Thursday. The precious metal's recovery is bolstered by increasing political tensions in the Middle East, driving a safe-haven rush. From a technical standpoint, the daily chart of XAU/USD suggests further upside potential. The pair has surpassed all of its moving averages, with the 200-day Simple Moving Average (SMA) being the closest, located around $1,930. Meanwhile, technical indicators are pointing upwards, with the Momentum indicator near overbought levels. According to the Relative Strength Index (RSI), it continues to climb and stays at new highs for several months.
In the short term, the 4-hour chart shows that a minor corrective decline may occur, but it also indicates that the uptrend remains intact for XAU/USD. The SMA 20 is moving strongly to the upside compared to longer SMAs, providing dynamic support around $1,926.50. However, the Momentum indicator has eased after reaching a lower high but still significantly above its midline. The RSI has also slightly declined but remains within the overbought territory.
Support Levels: $1,938.20, $1,926.50, $1,912.35
Resistance Levels: $1,962.60, $1,978.90, $1,987.40
In the short term, the 4-hour chart shows that a minor corrective decline may occur, but it also indicates that the uptrend remains intact for XAU/USD. The SMA 20 is moving strongly to the upside compared to longer SMAs, providing dynamic support around $1,926.50. However, the Momentum indicator has eased after reaching a lower high but still significantly above its midline. The RSI has also slightly declined but remains within the overbought territory.
Support Levels: $1,938.20, $1,926.50, $1,912.35
Resistance Levels: $1,962.60, $1,978.90, $1,987.40

관련 발행물
면책사항
해당 정보와 게시물은 금융, 투자, 트레이딩 또는 기타 유형의 조언이나 권장 사항으로 간주되지 않으며, 트레이딩뷰에서 제공하거나 보증하는 것이 아닙니다. 자세한 내용은 이용 약관을 참조하세요.
관련 발행물
면책사항
해당 정보와 게시물은 금융, 투자, 트레이딩 또는 기타 유형의 조언이나 권장 사항으로 간주되지 않으며, 트레이딩뷰에서 제공하거나 보증하는 것이 아닙니다. 자세한 내용은 이용 약관을 참조하세요.