
Like Explained in the previous Idea about GOLD
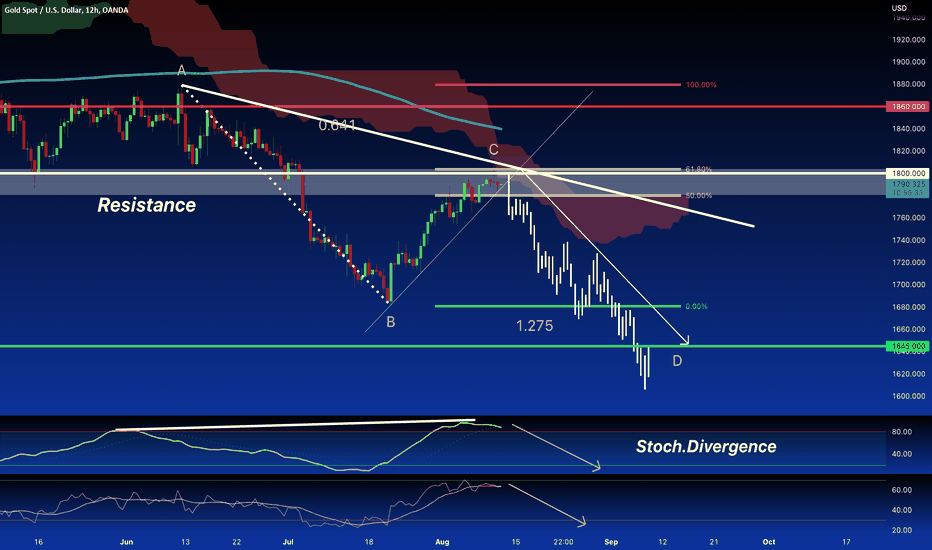
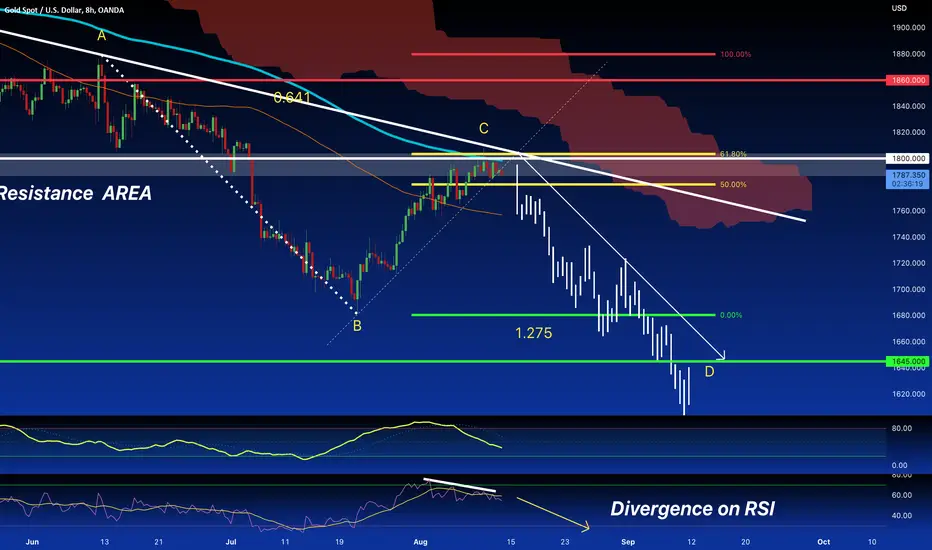
Today we Analyze the GOLD chart from the 8H timeframe for a better zoom of the situation. The price after a Deep Pullback, touched and reject the 61.8% Fibo area of resistance ( White rectangle ) around 1800.00 and, as we can see the price seems ready to revert its bullish momentum in favor of the Main trend, the Bearish one.The price also feel the 200 SMA in this timeframe like a dynamic resistance to not go over. The RSI is still in overbought with divergences, Ichimoku also in this timeframe gives a Bearish forecast and our clues continue to be for a Bearish setup.
Today we Analyze the GOLD chart from the 8H timeframe for a better zoom of the situation. The price after a Deep Pullback, touched and reject the 61.8% Fibo area of resistance ( White rectangle ) around 1800.00 and, as we can see the price seems ready to revert its bullish momentum in favor of the Main trend, the Bearish one.The price also feel the 200 SMA in this timeframe like a dynamic resistance to not go over. The RSI is still in overbought with divergences, Ichimoku also in this timeframe gives a Bearish forecast and our clues continue to be for a Bearish setup.
노트
NEW UPDATE 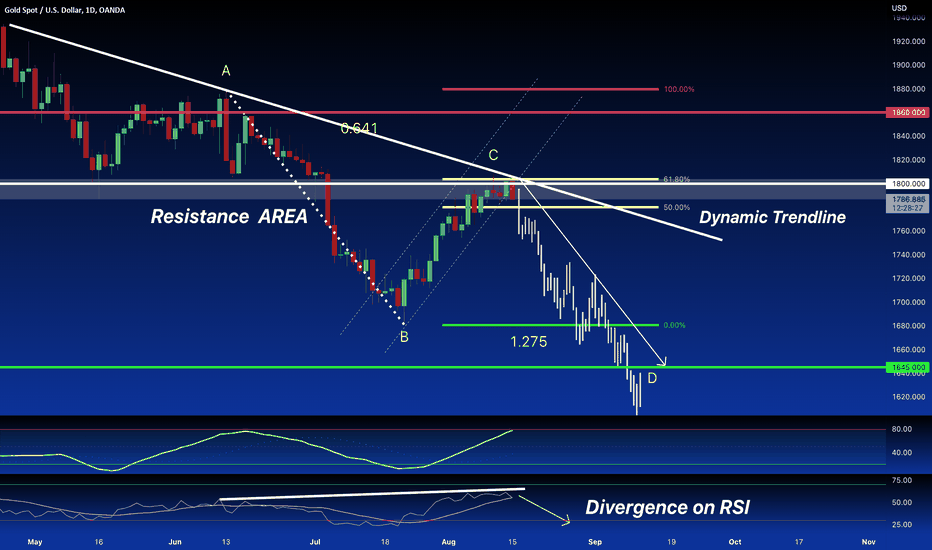

관련 발행물
면책사항
해당 정보와 게시물은 금융, 투자, 트레이딩 또는 기타 유형의 조언이나 권장 사항으로 간주되지 않으며, 트레이딩뷰에서 제공하거나 보증하는 것이 아닙니다. 자세한 내용은 이용 약관을 참조하세요.
관련 발행물
면책사항
해당 정보와 게시물은 금융, 투자, 트레이딩 또는 기타 유형의 조언이나 권장 사항으로 간주되지 않으며, 트레이딩뷰에서 제공하거나 보증하는 것이 아닙니다. 자세한 내용은 이용 약관을 참조하세요.