
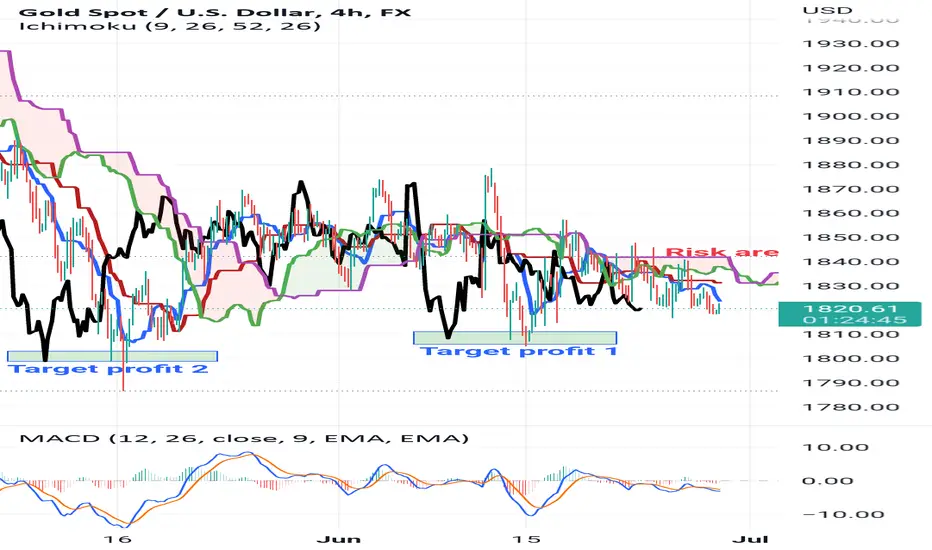
As we can see from 4H chart, from ichimoku indicator perspective, chikou span below the cloud, candle below the cloud, kijun above tenkan. It is indicating bearish market.
From MACD perspective it is below 0, which it is bearish market.
I also mark the risk area (red area) and possible taking profit area (blue color).
Happy trading. Manage your own risk and target.
From MACD perspective it is below 0, which it is bearish market.
I also mark the risk area (red area) and possible taking profit area (blue color).
Happy trading. Manage your own risk and target.

면책사항
해당 정보와 게시물은 금융, 투자, 트레이딩 또는 기타 유형의 조언이나 권장 사항으로 간주되지 않으며, 트레이딩뷰에서 제공하거나 보증하는 것이 아닙니다. 자세한 내용은 이용 약관을 참조하세요.
면책사항
해당 정보와 게시물은 금융, 투자, 트레이딩 또는 기타 유형의 조언이나 권장 사항으로 간주되지 않으며, 트레이딩뷰에서 제공하거나 보증하는 것이 아닙니다. 자세한 내용은 이용 약관을 참조하세요.