
Hi there
The 4-hour time frame gold chart structure has maintained its downward phase for the time being and we had liquidity accumulation last week.
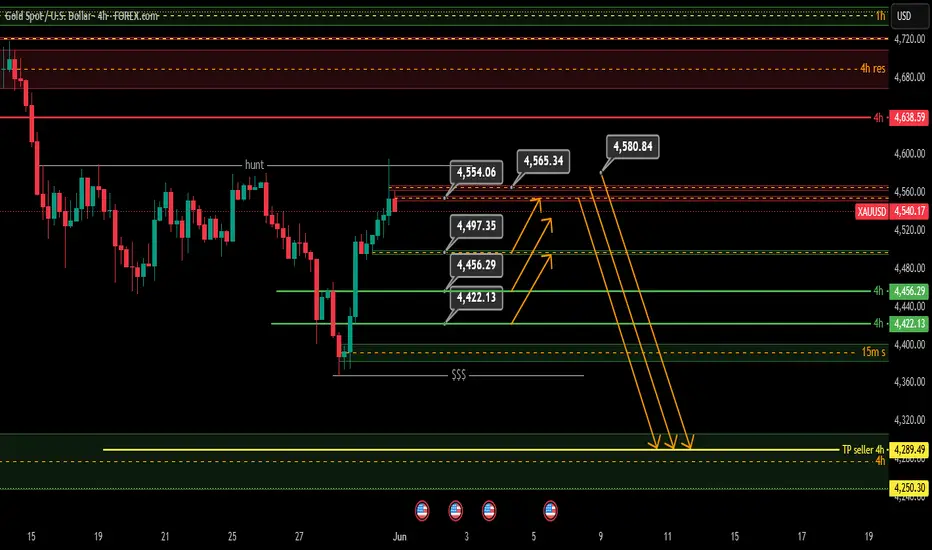
Considering the liquidity left at the last bottom, it can be considered that the goal of the upward lag is to accumulate liquidity (market fuel) to move towards the liquidity of this bottom. Considering this perspective, the important support points on the 4-hour chart are characterized by looking for a buy (pullback) at these three points in the lower time frame and if you see three important resistances, look for a trigger sell in the direction of the current market structure.
Similarly, the 4-hour algorithm is the seller's hand and the TP of this algorithm is defined as 4289.
Good luck.
The 4-hour time frame gold chart structure has maintained its downward phase for the time being and we had liquidity accumulation last week.
Considering the liquidity left at the last bottom, it can be considered that the goal of the upward lag is to accumulate liquidity (market fuel) to move towards the liquidity of this bottom. Considering this perspective, the important support points on the 4-hour chart are characterized by looking for a buy (pullback) at these three points in the lower time frame and if you see three important resistances, look for a trigger sell in the direction of the current market structure.
Similarly, the 4-hour algorithm is the seller's hand and the TP of this algorithm is defined as 4289.
Good luck.
액티브 트레이드
Gold 4-hour time frame chart update. Almost all targets from up to down were seen.
면책사항
해당 정보와 게시물은 금융, 투자, 트레이딩 또는 기타 유형의 조언이나 권장 사항으로 간주되지 않으며, 트레이딩뷰에서 제공하거나 보증하는 것이 아닙니다. 자세한 내용은 이용 약관을 참조하세요.
면책사항
해당 정보와 게시물은 금융, 투자, 트레이딩 또는 기타 유형의 조언이나 권장 사항으로 간주되지 않으며, 트레이딩뷰에서 제공하거나 보증하는 것이 아닙니다. 자세한 내용은 이용 약관을 참조하세요.