
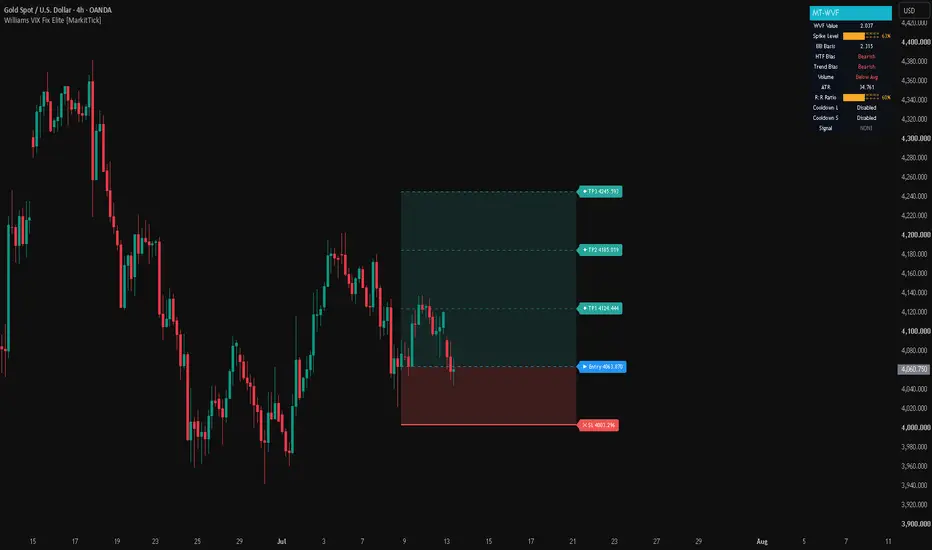
● Decoding the Williams VIX Fix: A Comprehensive Masterclass on Synthetic Volatility and Market Capitulation
● The Conceptual Origin
The financial markets are fundamentally driven by an intricate dichotomy of human emotion and algorithmic logic, continuously oscillating between the extreme poles of greed and fear.
In traditional equity markets, the Chicago Board Options Exchange Volatility Index, universally known as the VIX, serves as the premier macroeconomic barometer of this emotional spectrum.
The VIX quantifies the implied volatility of S&P 500 index options, effectively distilling the broader market's aggregate expectation of future price turbulence into a singular, easily digestible metric.
However, the inherent structural limitation of the traditional VIX lies in its exclusivity; it is intrinsically bound to a specific index and heavily reliant on the presence of a robust, highly liquid options market.
For decades, traders operating in non-index instruments, emerging equities, foreign exchange markets, and decentralized cryptocurrency ecosystems found themselves completely devoid of an equivalent, universally applicable fear gauge.
Legendary trader and market theoretician Larry Williams recognized this profound void in quantitative technical analysis and sought a universal solution.
He understood from decades of empirical observation that true market bottoms are rarely characterized by quiet, low-volume consolidation; rather, they are forged in the fiery crucible of absolute panic and forced capitulation.
Williams aimed to engineer a diagnostic tool that could universally identify these moments of peak fear without requiring complex, mathematically dense option pricing models or implied volatility data streams.
The conceptual breakthrough culminated in the creation of the Williams VIX Fix, a synthetic volatility proxy derived entirely from pure, unadulterated price action.
The core philosophy underpinning this indicator is both elegantly simple and profoundly effective: market fear is most palpable and measurable when asset prices experience a rapid, precipitous collapse from a recently established high.
By quantifying the exact magnitude of this downside deviation, the Williams VIX Fix dynamically reconstructs the psychological and emotional environment of a market in extreme distress.
It essentially democratizes volatility analysis, granting retail and institutional participants alike the ability to overlay a highly responsive fear index onto absolutely any tradable asset, regardless of its underlying liquidity structure or the existence of derivative markets.
The inception of the Williams VIX Fix marked a definitive paradigm shift, transitioning the measurement of market sentiment from an esoteric options-derived calculation to an accessible, empirical price-action reality.
● Narrative Technical Analysis
To fully comprehend the operational prowess of the Williams VIX Fix, one must dissect its internal mechanics through a narrative lens, stripping away the mathematical nomenclature to reveal the raw behavioral logic it strictly encapsulates.
At its operational heart, the indicator conducts a relentless, bar-by-bar historical audit of recent price structure to gauge shifting sentiment.
The analytical sequence unfolds through several distinct, mathematically sound phases that map human emotion to empirical data:
• Establishing the Benchmark of Optimism: The calculation begins by isolating the absolute highest closing price over a specifically designated retrospective window, which most quantitative analysts default to a twenty-two-period cycle. This highest close represents the absolute zenith of recent market confidence, serving as a temporal anchor against which all subsequent price degradation and fear will be measured.
• Measuring Immediate Panic: Once this highest close benchmark is established, the indicator perpetually calculates the exact absolute distance between this high-water mark and the absolute lowest price of the current, ongoing trading session. This measurement is not an arbitrary number; it represents the exact depth of the immediate panic and the severity of the sell-off.
• Normalizing the Differential: When a market is experiencing a severe structural sell-off, the current low plunges significantly beneath the established highest close, generating a massive numerical differential. To ensure this specific measurement remains universally applicable across various assets of vastly differing nominal values, the differential is subsequently normalized by expressing the difference as a strict percentage of the highest close itself.
• Visualizing the Output: The resulting synthesized data is typically visualized across charting platforms as a dynamic histogram that rests perpetually at the bottom of a charting interface, separate from the primary price candles.
• Baseline Dormancy: During periods of steady, confident uptrends with low variance, the current lows remain relatively close to the highest closes, resulting in a dormant, visually subdued, and flat histogram profile.
• Explosive Expansion: The moment the market infrastructure fractures and panic selling ensues, the distance between the recent high and the current low violently expands, causing the histogram to spike vertically, perfectly mimicking the explosive nature of the traditional VIX during macroeconomic market crashes.
• Integrating Statistical Envelopes: To transcend simple, subjective visual observation and establish rigid statistical thresholds, advanced quantitative iterations of the Williams VIX Fix incorporate standard deviation envelopes, analogous to traditional Bollinger Bands, directly over the synthetic volatility data feed.
• Defining Anomalies: By calculating a moving average of the volatility readings and projecting standard deviation bands above it, the indicator can definitively and mathematically highlight exactly when a volatility spike is statistically anomalous compared to the asset's recent baseline behavior.
• Percentile Ranking Channels: Furthermore, percentile ranking channels are often superimposed over the data, heavily isolating the extreme upper decile (typically the top fifteen percent) of recent volatility readings to filter out localized noise.
• Confirming Capitulation: When the synthetic volatility histogram aggressively pierces these upper standard deviation bands or the pre-defined percentile thresholds, the indicator effectively signals a state of mathematical and statistical capitulation, strongly suggesting that the aggressive selling pressure has reached an unsustainable crescendo.
● Institutional vs. Retail Perspective
The stark divergence in how the Williams VIX Fix is interpreted, parameterized, and deployed by disparate market participants effectively highlights the massive chasm between retail impulsivity and institutional calculated precision.
The retail trading demographic often falls victim to a highly rudimentary and dangerous interpretation of the indicator's raw outputs without secondary validation.
When the synthetic volatility histogram flashes a vibrant extreme reading, visually signifying a severe market capitulation, a statistically significant portion of retail participants interpret this strictly as a definitive, unyielding signal to immediately execute long positions with heavy leverage.
They consistently treat the isolated volatility spike as a standalone guarantee of a permanent market reversal, attempting to aggressively catch a proverbial falling knife without corroborating the signal with any broader macro or micro market context.
This deterministic, single-variable approach often leads to catastrophic, unrecoverable drawdowns when a market transitions from a standard technical pullback into a protracted, cascading structural bear market phase.
Conversely, the institutional and quantitative perspective approaches the Williams VIX Fix with a profound sense of nuance, statistical rigor, and strategic contextualization.
For quantitative hedge funds, proprietary algorithmic trading desks, and institutional liquidity providers, a synthetic volatility spike is never viewed as an isolated green light for blind, aggressive accumulation.
Instead, the metric is seamlessly integrated into a vast, complex confluence of macroeconomic drivers and microstructural tape variables.
Institutions view these extreme, localized volatility readings as highly explicit maps of immediate liquidity pools that they can effectively harvest.
When the Williams VIX Fix registers a peak fear reading, sophisticated institutions intrinsically understand that retail participants are panic-selling, liquidating portfolios, and triggering cascaded stop-loss orders en masse.
This mass capitulation generates the immense, highly concentrated liquidity required by large entities to accumulate significant, market-moving positions without experiencing heavily adverse execution slippage.
Furthermore, institutional algorithmic pricing models utilize the Williams VIX Fix as a secondary contextual filter rather than a primary, standalone trade trigger.
They rigorously cross-reference the synthetic volatility extreme with real-time order flow imbalances, cumulative volume delta shifts, and historically significant institutional supply and demand zones.
If the volatility spike occurs exactly at a pre-determined, higher-timeframe structural support level, and is simultaneously accompanied by a massive, visible absorption of passive sell orders on the order book, the institutional framework mathematically validates the reversal signal.
They are not merely buying because a popular indicator spiked; they are utilizing the synthetic volatility metric to formally confirm the complete psychological exhaustion of the opposing market participants, strategically entering the market only when the probability of a systemic reversal is proven to be heavily asymmetrical in their favor.
● Strategic Variance
The true operational efficacy and statistical reliability of the Williams VIX Fix are highly contingent upon the overarching, dominant market regime in which the indicator is actively deployed.
Its behavioral output and signal generation reliability shift dramatically across trending, ranging, and hyper-volatile liquidation environments, requiring traders to adapt their interpretation dynamically.
Understanding these critical strategic variances is absolutely paramount for systematically avoiding false, low-probability signals and optimizing entry precision across the entire portfolio.
• The Trending Market Regime: In a robust, structurally sound, and confirmed bullish trend, the Williams VIX Fix operates at its absolute optimum level of statistical reliability. During aggressive, prolonged uptrends, markets periodically experience sharp, violent pullbacks designed by larger participants to flush out weak retail hands and mathematically reset oscillator extremes. In this specific environment, when the synthetic volatility histogram sharply spikes and decisively breaches the upper standard deviation thresholds, it provides an exceptionally high-probability opportunity to execute a highly lucrative buy-the-dip strategy. The overarching, dominant momentum of the broader market acts as a fundamental macro tailwind, dramatically increasing the statistical likelihood that the panic low accurately identified by the indicator will hold firmly as a permanent, higher timeframe structural low.
• The Ranging Market Regime: When a market fundamentally transitions into a protracted period of sideways consolidation, largely devoid of clear directional momentum, the indicator's utility must be heavily and critically recalibrated. In a choppy, trendless, and highly compressed environment, price action frequently whipsaws violently between strictly defined overhead resistance and underlying support boundaries. Consequently, the Williams VIX Fix may artificially generate frequent, smaller histogram spikes as the price rapidly oscillates without true directional conviction. These specific signals are fundamentally less reliable because they are not organically driven by true systemic market capitulation or genuine fear, but rather by the natural, mathematical turbulence of a tightly compressed market structure seeking liquidity. Quantitative traders must therefore demand extreme, entirely unprecedented spikes in the indicator during a range-bound market, effectively utilizing larger standard deviation multipliers to filter out the ambient noise of consolidation before ever considering a live market entry.
• The High Volatility and Bear Market Regime: The absolute most treacherous and financially dangerous environment for deploying the Williams VIX Fix is a sustained, aggressive structural bear market characterized by relentless, cascading macro liquidations. In these apocalyptic scenarios, overall market fear can remain highly elevated for extended, incredibly painful durations that defy standard historical modeling. A severe macro sell-off may easily trigger a massive, record-breaking spike in the indicator, suggesting a definitive bottom, only for the market to consolidate briefly before plunging even lower, triggering yet another extreme reading on the histogram. This destructive phenomenon, commonly known in quantitative circles as a volatility cluster, systematically traps premature retail buyers in inescapable drawdowns. In these catastrophic bear market regimes, traders absolutely must practice infinite patience and wait for robust secondary confirmation. A singular volatility spike alone is completely insufficient; it must logically be followed by a definitive, undeniable shift in market structure, such as the formation of a macro higher low followed immediately by a violent break of a preceding lower high, decisively indicating that institutional buyers have not only absorbed the panic but have aggressively and permanently reclaimed control of the auction process.
● Psychological Architecture
The neurological architecture of human trading psychology is intrinsically and fatally flawed when repeatedly subjected to the extreme, unyielding pressures of the global financial markets.
The human brain is evolutionarily hardwired for acute loss aversion, scientifically processing financial portfolio drawdowns with the exact same physiological intensity and hormonal responses as literal, life-threatening physical danger.
When an asset's price begins to plummet aggressively, a severe cascade of destructive cognitive biases immediately takes over the retail trader's decision-making process.
Recency bias powerfully convinces the trader that the immediate, terrifying downward trajectory will organically continue indefinitely into the abyss, destroying all remaining capital.
Simultaneously, the amygdala rapidly initiates an overwhelming systemic fear response, completely overriding the prefrontal cortex's capacity for logical reasoning, statistical analysis, and strict adherence to a pre-defined trading plan.
It is in this exact, highly stressful environment of complete psychological capitulation that the average, untrained market participant liquidates their holdings at the absolute worst possible historical moment, effectively and permanently crystallizing their paper losses at the exact mathematical market bottom.
The Williams VIX Fix serves as a profound, highly necessary psychological anchor, functioning as an objective, emotionless mechanism strictly designed to forcefully circumvent these destructive emotional responses.
By mathematically and coldly quantifying the exact distance between the highest close and the current low, it perfectly translates the highly subjective feeling of blind panic into a rigid, empirical, and undeniably visual data point on the screen.
When a professional trader observes the synthetic volatility histogram exploding vertically into the upper standard deviation bands, it acts as a stark, mechanical, and highly visible reminder that the broader market is currently experiencing an unsustainable emotional extreme.
It forces the disciplined trader to formally acknowledge that the current, terrifying price action is largely driven by irrational, unchecked fear rather than any logical shift in fundamental macro valuation.
However, successfully utilizing this indicator in live market conditions demands a radical, often uncomfortable rewiring of the trader's deepest behavioral instincts.
It absolutely requires the immense psychological fortitude to actively step into the financial arena precisely when every natural, evolutionary instinct is screaming to immediately flee the danger.
It strictly demands that the trader train themselves to view aggressive, high-volume red candles and widespread retail market pessimism not as a terminal threat to their portfolio, but as the foundational, necessary ingredients of immense asymmetrical opportunity.
The true, underlying mastery of the Williams VIX Fix is fundamentally not merely technical or mathematical; it is deeply and undeniably psychological in nature.
It is the rare ability to maintain perfect cognitive clarity and flawless execution logic when the aggregate market has completely lost its collective mind, utilizing objective, synthetic volatility metrics to ruthlessly exploit the emotional exhaustion and forced liquidations of the uneducated masses.
● Risk & Probability Sagas
Engaging actively with the institutional financial markets, even when fully equipped with highly sophisticated, historically proven diagnostic tools like the Williams VIX Fix, is an endless, unforgiving saga of strict risk management and cold probability assessment.
It is mathematically imperative to deeply acknowledge that absolutely no technical indicator, regardless of its underlying conceptual brilliance or its pristine historical backtesting performance metrics, possesses a flawless, infallible predictive capacity regarding future price action.
The synthetic volatility index is strictly a present-tense barometer of immediate market condition, not a mystical crystal ball capable of forecasting future directional momentum with absolute certainty.
Therefore, the active integration of this indicator into any professional trading framework must unconditionally be accompanied by a draconian, uncompromising adherence to strict mathematical risk mitigation protocols.
The entire philosophical essence of highly profitable quantitative trading revolves endlessly around the precise identification and exploitation of highly asymmetric risk-to-reward profiles.
When the Williams VIX Fix definitively signals an extreme, historically anomalous capitulation event, it suggests probabilistically that the immediate downside risk is statistically compressed, while the underlying potential for an explosive, mean-reverting upside move is heavily expanded.
However, this statistical probability must always be aggressively and systematically protected by the trader.
Total capital allocation per trade must remain highly calculated and strictly controlled; risking a disproportionate, massive percentage of total portfolio equity on a single, unconfirmed volatility signal is an absolute recipe for catastrophic financial ruin, particularly if the broader market is quietly undergoing a fundamental, paradigm-shifting structural change rather than a temporary, localized emotional flush.
Position sizing models should therefore dynamically and continuously adjust based exclusively on the rigorously confirmed prevailing market regime.
During a widely confirmed, structurally sound bullish trend where the indicator provides a clean buy-the-dip signal, standard, baseline position sizing parameters may be entirely appropriate and mathematically justified.
Conversely, if an aggressive trader is actively attempting to catch a falling capitulation bottom during a violent, headline-driven macro-economic sell-off, position sizing must unconditionally be drastically reduced to account for the severely heightened potential of cascading failures and localized market contagion.
Hard stop-loss mechanisms must always be placed with undeniable structural logic, designed strictly to entirely invalidate the foundational trade premise if the underlying panic low identified by the indicator is subsequently breached by sustained selling pressure.
Ultimately, long-term survival, consistent capital preservation, and massive profitability in the highly competitive realm of quantitative trading rely absolutely not on the perceived infallibility of the volatility signal itself, but exclusively on the flawless, robotic execution of rigid risk parameters when the inevitable statistical anomalies inevitably arise and the market violently defies all historical precedent.
We integrated the core logic of the Williams VIX Fix into our Williams VIX Fix Elite indicator. Furthermore, we applied specific technical refinements designed to filter out market noise and significantly minimize false signals.
● Professional Financial Risk Warning: The technical analysis, concepts, psychological frameworks, and trading strategies discussed extensively within this literature are provided strictly for educational and informational purposes only. The global financial markets exhibit inherent, unpredictable, and extreme volatility, and active participation carries a substantial, ever-present risk of severe capital loss. The Williams VIX Fix, alongside any other quantitative or technical indicator, emphatically does not guarantee future performance, nor does it provide consistently accurate market predictions. You are strongly advised and fundamentally required to conduct your own comprehensive due diligence, rigorously backtest all theoretical frameworks against historical data, and consult directly with a certified, independent financial advisor prior to executing any live market transactions. Trading on margin or utilizing complex leveraged derivatives massively amplifies both your potential returns and your potential for catastrophic losses. Never allocate capital to the financial markets that you cannot afford to completely and permanently lose. Past market behavior and historical indicator performance are never a reliable indicator or guarantee of future price action.
● The Conceptual Origin
The financial markets are fundamentally driven by an intricate dichotomy of human emotion and algorithmic logic, continuously oscillating between the extreme poles of greed and fear.
In traditional equity markets, the Chicago Board Options Exchange Volatility Index, universally known as the VIX, serves as the premier macroeconomic barometer of this emotional spectrum.
The VIX quantifies the implied volatility of S&P 500 index options, effectively distilling the broader market's aggregate expectation of future price turbulence into a singular, easily digestible metric.
However, the inherent structural limitation of the traditional VIX lies in its exclusivity; it is intrinsically bound to a specific index and heavily reliant on the presence of a robust, highly liquid options market.
For decades, traders operating in non-index instruments, emerging equities, foreign exchange markets, and decentralized cryptocurrency ecosystems found themselves completely devoid of an equivalent, universally applicable fear gauge.
Legendary trader and market theoretician Larry Williams recognized this profound void in quantitative technical analysis and sought a universal solution.
He understood from decades of empirical observation that true market bottoms are rarely characterized by quiet, low-volume consolidation; rather, they are forged in the fiery crucible of absolute panic and forced capitulation.
Williams aimed to engineer a diagnostic tool that could universally identify these moments of peak fear without requiring complex, mathematically dense option pricing models or implied volatility data streams.
The conceptual breakthrough culminated in the creation of the Williams VIX Fix, a synthetic volatility proxy derived entirely from pure, unadulterated price action.
The core philosophy underpinning this indicator is both elegantly simple and profoundly effective: market fear is most palpable and measurable when asset prices experience a rapid, precipitous collapse from a recently established high.
By quantifying the exact magnitude of this downside deviation, the Williams VIX Fix dynamically reconstructs the psychological and emotional environment of a market in extreme distress.
It essentially democratizes volatility analysis, granting retail and institutional participants alike the ability to overlay a highly responsive fear index onto absolutely any tradable asset, regardless of its underlying liquidity structure or the existence of derivative markets.
The inception of the Williams VIX Fix marked a definitive paradigm shift, transitioning the measurement of market sentiment from an esoteric options-derived calculation to an accessible, empirical price-action reality.
● Narrative Technical Analysis
To fully comprehend the operational prowess of the Williams VIX Fix, one must dissect its internal mechanics through a narrative lens, stripping away the mathematical nomenclature to reveal the raw behavioral logic it strictly encapsulates.
At its operational heart, the indicator conducts a relentless, bar-by-bar historical audit of recent price structure to gauge shifting sentiment.
The analytical sequence unfolds through several distinct, mathematically sound phases that map human emotion to empirical data:
• Establishing the Benchmark of Optimism: The calculation begins by isolating the absolute highest closing price over a specifically designated retrospective window, which most quantitative analysts default to a twenty-two-period cycle. This highest close represents the absolute zenith of recent market confidence, serving as a temporal anchor against which all subsequent price degradation and fear will be measured.
• Measuring Immediate Panic: Once this highest close benchmark is established, the indicator perpetually calculates the exact absolute distance between this high-water mark and the absolute lowest price of the current, ongoing trading session. This measurement is not an arbitrary number; it represents the exact depth of the immediate panic and the severity of the sell-off.
• Normalizing the Differential: When a market is experiencing a severe structural sell-off, the current low plunges significantly beneath the established highest close, generating a massive numerical differential. To ensure this specific measurement remains universally applicable across various assets of vastly differing nominal values, the differential is subsequently normalized by expressing the difference as a strict percentage of the highest close itself.
• Visualizing the Output: The resulting synthesized data is typically visualized across charting platforms as a dynamic histogram that rests perpetually at the bottom of a charting interface, separate from the primary price candles.
• Baseline Dormancy: During periods of steady, confident uptrends with low variance, the current lows remain relatively close to the highest closes, resulting in a dormant, visually subdued, and flat histogram profile.
• Explosive Expansion: The moment the market infrastructure fractures and panic selling ensues, the distance between the recent high and the current low violently expands, causing the histogram to spike vertically, perfectly mimicking the explosive nature of the traditional VIX during macroeconomic market crashes.
• Integrating Statistical Envelopes: To transcend simple, subjective visual observation and establish rigid statistical thresholds, advanced quantitative iterations of the Williams VIX Fix incorporate standard deviation envelopes, analogous to traditional Bollinger Bands, directly over the synthetic volatility data feed.
• Defining Anomalies: By calculating a moving average of the volatility readings and projecting standard deviation bands above it, the indicator can definitively and mathematically highlight exactly when a volatility spike is statistically anomalous compared to the asset's recent baseline behavior.
• Percentile Ranking Channels: Furthermore, percentile ranking channels are often superimposed over the data, heavily isolating the extreme upper decile (typically the top fifteen percent) of recent volatility readings to filter out localized noise.
• Confirming Capitulation: When the synthetic volatility histogram aggressively pierces these upper standard deviation bands or the pre-defined percentile thresholds, the indicator effectively signals a state of mathematical and statistical capitulation, strongly suggesting that the aggressive selling pressure has reached an unsustainable crescendo.
● Institutional vs. Retail Perspective
The stark divergence in how the Williams VIX Fix is interpreted, parameterized, and deployed by disparate market participants effectively highlights the massive chasm between retail impulsivity and institutional calculated precision.
The retail trading demographic often falls victim to a highly rudimentary and dangerous interpretation of the indicator's raw outputs without secondary validation.
When the synthetic volatility histogram flashes a vibrant extreme reading, visually signifying a severe market capitulation, a statistically significant portion of retail participants interpret this strictly as a definitive, unyielding signal to immediately execute long positions with heavy leverage.
They consistently treat the isolated volatility spike as a standalone guarantee of a permanent market reversal, attempting to aggressively catch a proverbial falling knife without corroborating the signal with any broader macro or micro market context.
This deterministic, single-variable approach often leads to catastrophic, unrecoverable drawdowns when a market transitions from a standard technical pullback into a protracted, cascading structural bear market phase.
Conversely, the institutional and quantitative perspective approaches the Williams VIX Fix with a profound sense of nuance, statistical rigor, and strategic contextualization.
For quantitative hedge funds, proprietary algorithmic trading desks, and institutional liquidity providers, a synthetic volatility spike is never viewed as an isolated green light for blind, aggressive accumulation.
Instead, the metric is seamlessly integrated into a vast, complex confluence of macroeconomic drivers and microstructural tape variables.
Institutions view these extreme, localized volatility readings as highly explicit maps of immediate liquidity pools that they can effectively harvest.
When the Williams VIX Fix registers a peak fear reading, sophisticated institutions intrinsically understand that retail participants are panic-selling, liquidating portfolios, and triggering cascaded stop-loss orders en masse.
This mass capitulation generates the immense, highly concentrated liquidity required by large entities to accumulate significant, market-moving positions without experiencing heavily adverse execution slippage.
Furthermore, institutional algorithmic pricing models utilize the Williams VIX Fix as a secondary contextual filter rather than a primary, standalone trade trigger.
They rigorously cross-reference the synthetic volatility extreme with real-time order flow imbalances, cumulative volume delta shifts, and historically significant institutional supply and demand zones.
If the volatility spike occurs exactly at a pre-determined, higher-timeframe structural support level, and is simultaneously accompanied by a massive, visible absorption of passive sell orders on the order book, the institutional framework mathematically validates the reversal signal.
They are not merely buying because a popular indicator spiked; they are utilizing the synthetic volatility metric to formally confirm the complete psychological exhaustion of the opposing market participants, strategically entering the market only when the probability of a systemic reversal is proven to be heavily asymmetrical in their favor.
● Strategic Variance
The true operational efficacy and statistical reliability of the Williams VIX Fix are highly contingent upon the overarching, dominant market regime in which the indicator is actively deployed.
Its behavioral output and signal generation reliability shift dramatically across trending, ranging, and hyper-volatile liquidation environments, requiring traders to adapt their interpretation dynamically.
Understanding these critical strategic variances is absolutely paramount for systematically avoiding false, low-probability signals and optimizing entry precision across the entire portfolio.
• The Trending Market Regime: In a robust, structurally sound, and confirmed bullish trend, the Williams VIX Fix operates at its absolute optimum level of statistical reliability. During aggressive, prolonged uptrends, markets periodically experience sharp, violent pullbacks designed by larger participants to flush out weak retail hands and mathematically reset oscillator extremes. In this specific environment, when the synthetic volatility histogram sharply spikes and decisively breaches the upper standard deviation thresholds, it provides an exceptionally high-probability opportunity to execute a highly lucrative buy-the-dip strategy. The overarching, dominant momentum of the broader market acts as a fundamental macro tailwind, dramatically increasing the statistical likelihood that the panic low accurately identified by the indicator will hold firmly as a permanent, higher timeframe structural low.
• The Ranging Market Regime: When a market fundamentally transitions into a protracted period of sideways consolidation, largely devoid of clear directional momentum, the indicator's utility must be heavily and critically recalibrated. In a choppy, trendless, and highly compressed environment, price action frequently whipsaws violently between strictly defined overhead resistance and underlying support boundaries. Consequently, the Williams VIX Fix may artificially generate frequent, smaller histogram spikes as the price rapidly oscillates without true directional conviction. These specific signals are fundamentally less reliable because they are not organically driven by true systemic market capitulation or genuine fear, but rather by the natural, mathematical turbulence of a tightly compressed market structure seeking liquidity. Quantitative traders must therefore demand extreme, entirely unprecedented spikes in the indicator during a range-bound market, effectively utilizing larger standard deviation multipliers to filter out the ambient noise of consolidation before ever considering a live market entry.
• The High Volatility and Bear Market Regime: The absolute most treacherous and financially dangerous environment for deploying the Williams VIX Fix is a sustained, aggressive structural bear market characterized by relentless, cascading macro liquidations. In these apocalyptic scenarios, overall market fear can remain highly elevated for extended, incredibly painful durations that defy standard historical modeling. A severe macro sell-off may easily trigger a massive, record-breaking spike in the indicator, suggesting a definitive bottom, only for the market to consolidate briefly before plunging even lower, triggering yet another extreme reading on the histogram. This destructive phenomenon, commonly known in quantitative circles as a volatility cluster, systematically traps premature retail buyers in inescapable drawdowns. In these catastrophic bear market regimes, traders absolutely must practice infinite patience and wait for robust secondary confirmation. A singular volatility spike alone is completely insufficient; it must logically be followed by a definitive, undeniable shift in market structure, such as the formation of a macro higher low followed immediately by a violent break of a preceding lower high, decisively indicating that institutional buyers have not only absorbed the panic but have aggressively and permanently reclaimed control of the auction process.
● Psychological Architecture
The neurological architecture of human trading psychology is intrinsically and fatally flawed when repeatedly subjected to the extreme, unyielding pressures of the global financial markets.
The human brain is evolutionarily hardwired for acute loss aversion, scientifically processing financial portfolio drawdowns with the exact same physiological intensity and hormonal responses as literal, life-threatening physical danger.
When an asset's price begins to plummet aggressively, a severe cascade of destructive cognitive biases immediately takes over the retail trader's decision-making process.
Recency bias powerfully convinces the trader that the immediate, terrifying downward trajectory will organically continue indefinitely into the abyss, destroying all remaining capital.
Simultaneously, the amygdala rapidly initiates an overwhelming systemic fear response, completely overriding the prefrontal cortex's capacity for logical reasoning, statistical analysis, and strict adherence to a pre-defined trading plan.
It is in this exact, highly stressful environment of complete psychological capitulation that the average, untrained market participant liquidates their holdings at the absolute worst possible historical moment, effectively and permanently crystallizing their paper losses at the exact mathematical market bottom.
The Williams VIX Fix serves as a profound, highly necessary psychological anchor, functioning as an objective, emotionless mechanism strictly designed to forcefully circumvent these destructive emotional responses.
By mathematically and coldly quantifying the exact distance between the highest close and the current low, it perfectly translates the highly subjective feeling of blind panic into a rigid, empirical, and undeniably visual data point on the screen.
When a professional trader observes the synthetic volatility histogram exploding vertically into the upper standard deviation bands, it acts as a stark, mechanical, and highly visible reminder that the broader market is currently experiencing an unsustainable emotional extreme.
It forces the disciplined trader to formally acknowledge that the current, terrifying price action is largely driven by irrational, unchecked fear rather than any logical shift in fundamental macro valuation.
However, successfully utilizing this indicator in live market conditions demands a radical, often uncomfortable rewiring of the trader's deepest behavioral instincts.
It absolutely requires the immense psychological fortitude to actively step into the financial arena precisely when every natural, evolutionary instinct is screaming to immediately flee the danger.
It strictly demands that the trader train themselves to view aggressive, high-volume red candles and widespread retail market pessimism not as a terminal threat to their portfolio, but as the foundational, necessary ingredients of immense asymmetrical opportunity.
The true, underlying mastery of the Williams VIX Fix is fundamentally not merely technical or mathematical; it is deeply and undeniably psychological in nature.
It is the rare ability to maintain perfect cognitive clarity and flawless execution logic when the aggregate market has completely lost its collective mind, utilizing objective, synthetic volatility metrics to ruthlessly exploit the emotional exhaustion and forced liquidations of the uneducated masses.
● Risk & Probability Sagas
Engaging actively with the institutional financial markets, even when fully equipped with highly sophisticated, historically proven diagnostic tools like the Williams VIX Fix, is an endless, unforgiving saga of strict risk management and cold probability assessment.
It is mathematically imperative to deeply acknowledge that absolutely no technical indicator, regardless of its underlying conceptual brilliance or its pristine historical backtesting performance metrics, possesses a flawless, infallible predictive capacity regarding future price action.
The synthetic volatility index is strictly a present-tense barometer of immediate market condition, not a mystical crystal ball capable of forecasting future directional momentum with absolute certainty.
Therefore, the active integration of this indicator into any professional trading framework must unconditionally be accompanied by a draconian, uncompromising adherence to strict mathematical risk mitigation protocols.
The entire philosophical essence of highly profitable quantitative trading revolves endlessly around the precise identification and exploitation of highly asymmetric risk-to-reward profiles.
When the Williams VIX Fix definitively signals an extreme, historically anomalous capitulation event, it suggests probabilistically that the immediate downside risk is statistically compressed, while the underlying potential for an explosive, mean-reverting upside move is heavily expanded.
However, this statistical probability must always be aggressively and systematically protected by the trader.
Total capital allocation per trade must remain highly calculated and strictly controlled; risking a disproportionate, massive percentage of total portfolio equity on a single, unconfirmed volatility signal is an absolute recipe for catastrophic financial ruin, particularly if the broader market is quietly undergoing a fundamental, paradigm-shifting structural change rather than a temporary, localized emotional flush.
Position sizing models should therefore dynamically and continuously adjust based exclusively on the rigorously confirmed prevailing market regime.
During a widely confirmed, structurally sound bullish trend where the indicator provides a clean buy-the-dip signal, standard, baseline position sizing parameters may be entirely appropriate and mathematically justified.
Conversely, if an aggressive trader is actively attempting to catch a falling capitulation bottom during a violent, headline-driven macro-economic sell-off, position sizing must unconditionally be drastically reduced to account for the severely heightened potential of cascading failures and localized market contagion.
Hard stop-loss mechanisms must always be placed with undeniable structural logic, designed strictly to entirely invalidate the foundational trade premise if the underlying panic low identified by the indicator is subsequently breached by sustained selling pressure.
Ultimately, long-term survival, consistent capital preservation, and massive profitability in the highly competitive realm of quantitative trading rely absolutely not on the perceived infallibility of the volatility signal itself, but exclusively on the flawless, robotic execution of rigid risk parameters when the inevitable statistical anomalies inevitably arise and the market violently defies all historical precedent.
We integrated the core logic of the Williams VIX Fix into our Williams VIX Fix Elite indicator. Furthermore, we applied specific technical refinements designed to filter out market noise and significantly minimize false signals.
● Professional Financial Risk Warning: The technical analysis, concepts, psychological frameworks, and trading strategies discussed extensively within this literature are provided strictly for educational and informational purposes only. The global financial markets exhibit inherent, unpredictable, and extreme volatility, and active participation carries a substantial, ever-present risk of severe capital loss. The Williams VIX Fix, alongside any other quantitative or technical indicator, emphatically does not guarantee future performance, nor does it provide consistently accurate market predictions. You are strongly advised and fundamentally required to conduct your own comprehensive due diligence, rigorously backtest all theoretical frameworks against historical data, and consult directly with a certified, independent financial advisor prior to executing any live market transactions. Trading on margin or utilizing complex leveraged derivatives massively amplifies both your potential returns and your potential for catastrophic losses. Never allocate capital to the financial markets that you cannot afford to completely and permanently lose. Past market behavior and historical indicator performance are never a reliable indicator or guarantee of future price action.

💡 Proprietary indicators. Original research. Built by analysts who trade.
👑 Premium: markittick.com
📢 Free Telegram: t.me/MarkitTick_Updates
👑 Premium: markittick.com
📢 Free Telegram: t.me/MarkitTick_Updates
면책사항
해당 정보와 게시물은 금융, 투자, 트레이딩 또는 기타 유형의 조언이나 권장 사항으로 간주되지 않으며, 트레이딩뷰에서 제공하거나 보증하는 것이 아닙니다. 자세한 내용은 이용 약관을 참조하세요.
💡 Proprietary indicators. Original research. Built by analysts who trade.
👑 Premium: markittick.com
📢 Free Telegram: t.me/MarkitTick_Updates
👑 Premium: markittick.com
📢 Free Telegram: t.me/MarkitTick_Updates
면책사항
해당 정보와 게시물은 금융, 투자, 트레이딩 또는 기타 유형의 조언이나 권장 사항으로 간주되지 않으며, 트레이딩뷰에서 제공하거나 보증하는 것이 아닙니다. 자세한 내용은 이용 약관을 참조하세요.