
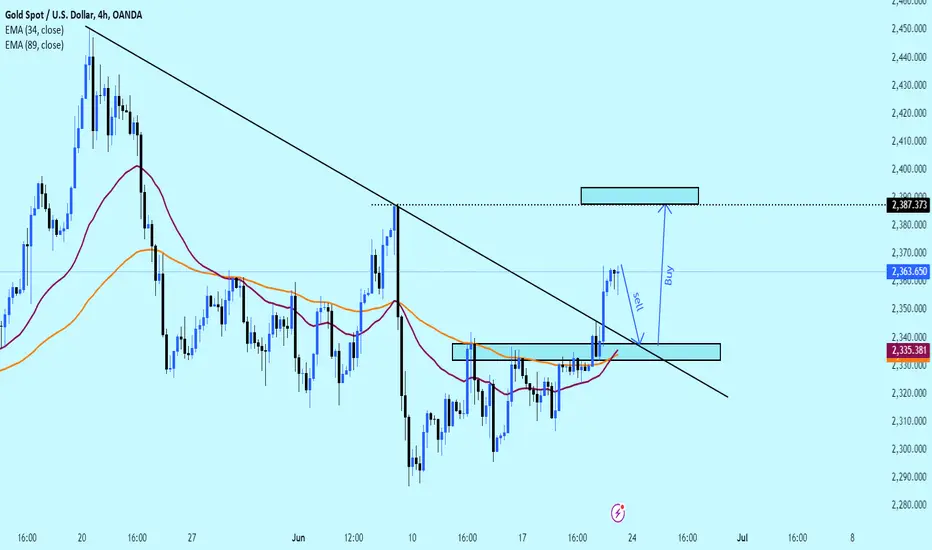
Current Trend: The 4-hour chart shows gold in a short-term uptrend. The price is above the EMA 34 and EMA 89, showing that the upward momentum is still strong.
Critical Support Zone: 2,335 USD - 2,333 USD, coincident with the EMAs, acting as a strong support zone.
Key Resistance: $2,387 is the resistance to watch out for. If the price breaks this level, the uptrend could be further strengthened.
Trading strategies:
Buy: When the price adjusts to the support area around 2,335 USD and shows signs of rebounding.
Sell: When the price approaches the resistance level of 2,387 USD and shows signs of strong rejection.
Critical Support Zone: 2,335 USD - 2,333 USD, coincident with the EMAs, acting as a strong support zone.
Key Resistance: $2,387 is the resistance to watch out for. If the price breaks this level, the uptrend could be further strengthened.
Trading strategies:
Buy: When the price adjusts to the support area around 2,335 USD and shows signs of rebounding.
Sell: When the price approaches the resistance level of 2,387 USD and shows signs of strong rejection.
액티브 트레이드
거래청산: 타겟 닿음
노트
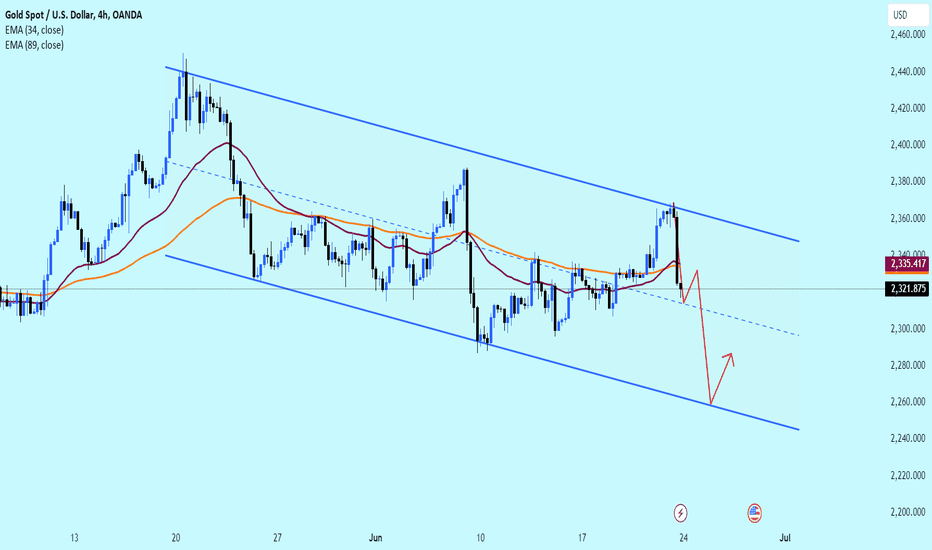

관련 발행물
면책사항
해당 정보와 게시물은 금융, 투자, 트레이딩 또는 기타 유형의 조언이나 권장 사항으로 간주되지 않으며, 트레이딩뷰에서 제공하거나 보증하는 것이 아닙니다. 자세한 내용은 이용 약관을 참조하세요.
관련 발행물
면책사항
해당 정보와 게시물은 금융, 투자, 트레이딩 또는 기타 유형의 조언이나 권장 사항으로 간주되지 않으며, 트레이딩뷰에서 제공하거나 보증하는 것이 아닙니다. 자세한 내용은 이용 약관을 참조하세요.