
Dear Traders,
I am initiating a new idea for Gold (XAUUSD) and in this analysis, I will cover the period from October 1st, 2022, up to today, August 19th, 2023.
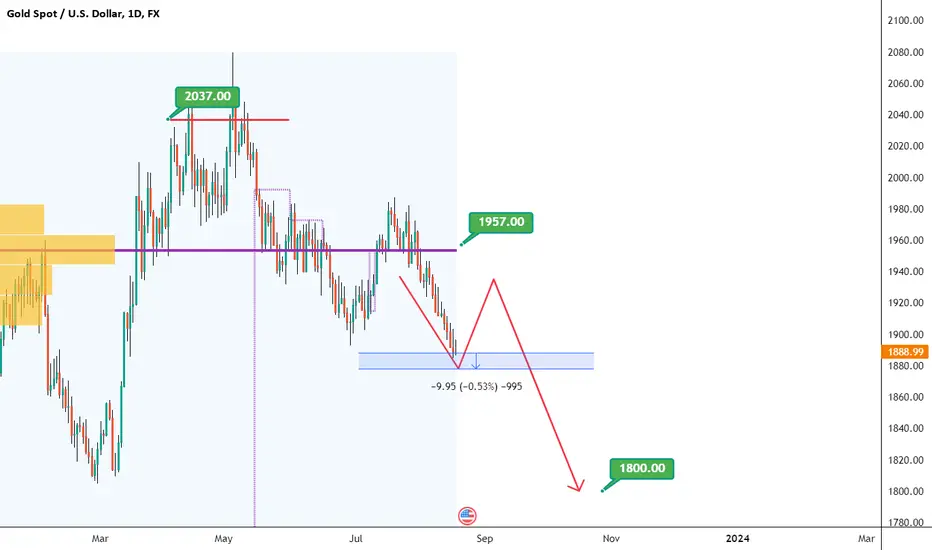
On the 1-day timeframe, if we apply an anchored volume profile to the entire period, a significant observation emerges: the price consistently gravitates around the Point of Control (POC) at $1957. Moreover, considering the highest resistance at $2037:
2037 - 1957 = 80
1957 - 80 = 1877
Thus, a reaction is likely between the range of $1888 to $1877. I will take this into account when delving into the 4-hour timeframe analysis. However, the question of the final target on the daily chart necessitates an extension of the anchored volume profile's timeframe, encompassing the sideways wave that began in August 2020, ranging from $1800 to $1820. I will update the analysis once this level is reached.

Shifting to the 4-hour timeframe, with an anchored volume profile set from July 19th, 2023, at $1980, we observe a Point of Control (POC) at $1934.
1980 - 1935 = 45
1935 + 45 = 1980

Hence, a reaction can be anticipated within the range of $1880 to $1890, extending to $1935. For trading purposes, a buy position can be considered within this range, targeting $1935, with a stop-loss order set to close 1 day below $1875. The estimated date to achieve the target is September 4th. I will diligently monitor and manage this trade, providing daily updates as necessary.
I am initiating a new idea for Gold (XAUUSD) and in this analysis, I will cover the period from October 1st, 2022, up to today, August 19th, 2023.
On the 1-day timeframe, if we apply an anchored volume profile to the entire period, a significant observation emerges: the price consistently gravitates around the Point of Control (POC) at $1957. Moreover, considering the highest resistance at $2037:
2037 - 1957 = 80
1957 - 80 = 1877
Thus, a reaction is likely between the range of $1888 to $1877. I will take this into account when delving into the 4-hour timeframe analysis. However, the question of the final target on the daily chart necessitates an extension of the anchored volume profile's timeframe, encompassing the sideways wave that began in August 2020, ranging from $1800 to $1820. I will update the analysis once this level is reached.
Shifting to the 4-hour timeframe, with an anchored volume profile set from July 19th, 2023, at $1980, we observe a Point of Control (POC) at $1934.
1980 - 1935 = 45
1935 + 45 = 1980
Hence, a reaction can be anticipated within the range of $1880 to $1890, extending to $1935. For trading purposes, a buy position can be considered within this range, targeting $1935, with a stop-loss order set to close 1 day below $1875. The estimated date to achieve the target is September 4th. I will diligently monitor and manage this trade, providing daily updates as necessary.
노트
노트
거래청산: 타겟 닿음
Target 🎯 achieved거래청산: 타겟 닿음

면책사항
해당 정보와 게시물은 금융, 투자, 트레이딩 또는 기타 유형의 조언이나 권장 사항으로 간주되지 않으며, 트레이딩뷰에서 제공하거나 보증하는 것이 아닙니다. 자세한 내용은 이용 약관을 참조하세요.
면책사항
해당 정보와 게시물은 금융, 투자, 트레이딩 또는 기타 유형의 조언이나 권장 사항으로 간주되지 않으며, 트레이딩뷰에서 제공하거나 보증하는 것이 아닙니다. 자세한 내용은 이용 약관을 참조하세요.