
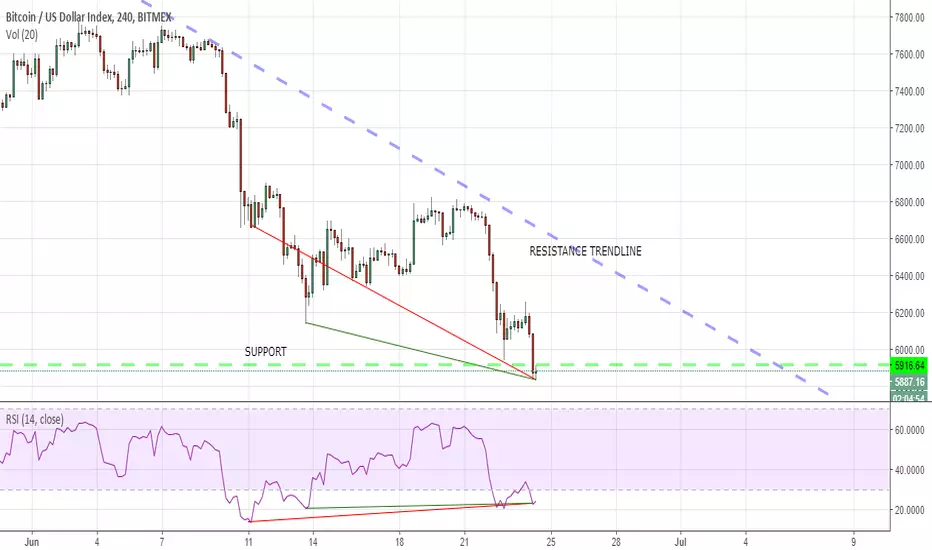
Whilst a break below support is still a very real risk - there is clear bullish price divergence on the 4 hr chart as well as the daily chart. This would suggest that support will hold - at least for now...
On this 4 hr chart we can see the red line and green lines linking respective low points on the Bitcoin price and RSI. Whilst the price falls over these periods, the RSI is rising. The suggests that price momentum is transitioning from bearish to bullish.
This may provide reason not to dump everything right now, but not enough to be loading up on a large long position. I'll be waiting for a clear break of either support or resistance trendline before making a directional call with any strong conviction.
노트
As expected the price did not capitulate below support. After threatening to break through there was a small short squeeze supported by the bullish divergence.However, as can be seen, the danger is not over and support is again under pressure - this time without any bullish divergence.

면책사항
해당 정보와 게시물은 금융, 투자, 트레이딩 또는 기타 유형의 조언이나 권장 사항으로 간주되지 않으며, 트레이딩뷰에서 제공하거나 보증하는 것이 아닙니다. 자세한 내용은 이용 약관을 참조하세요.
면책사항
해당 정보와 게시물은 금융, 투자, 트레이딩 또는 기타 유형의 조언이나 권장 사항으로 간주되지 않으며, 트레이딩뷰에서 제공하거나 보증하는 것이 아닙니다. 자세한 내용은 이용 약관을 참조하세요.