
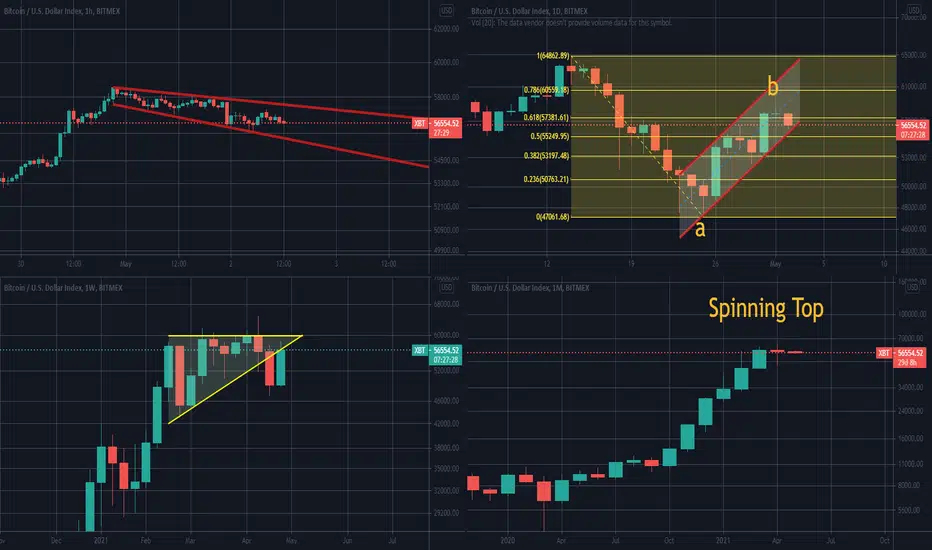
Hourly Chart: Expanding Triangle(Bearish)
Daily Chart: Bearish Flag + Doji followed by confirmation Candle at 0.618 Fibonacci level. (Bearish)
Weekly Chart: Closing below Flat Top triangle for 2 weeks, and Bullish Engulfing after a Spinning Top and confirmation. (Neutral-Bullish)
Monthly Chart: Spinning Top after 13 months of Parabolic price move.
Change in Average Dollar Value of Trades: in the first 4 months of 2021 in comparison to the last 4 months of 2020.
Conclusion: Bearish is the most probable scenario.
Moshkelgosha
Educational Articles:
1-Triangle:
https://www.investopedia.com/articles/technical/03/091003.asp
2- Retracement vs reversal:
https://www.investopedia.com/articles/trading/06/retracements.asp
3- Fibonacci Retracement Levels:
https://www.investopedia.com/terms/f/fibonacciretracement.asp
4-Flag:
https://www.investopedia.com/terms/f/flag.asp
5- Bullish Engulfing:
https://www.investopedia.com/terms/b/bullishengulfingpattern.asp
6-Spinning Top:
https://www.investopedia.com/terms/s/spinning-top.asp
7- Parabolic uptrend:
https://www.investopedia.com/what-you-need-to-know-about-tesla-s-parabolic-uptrend-4784179

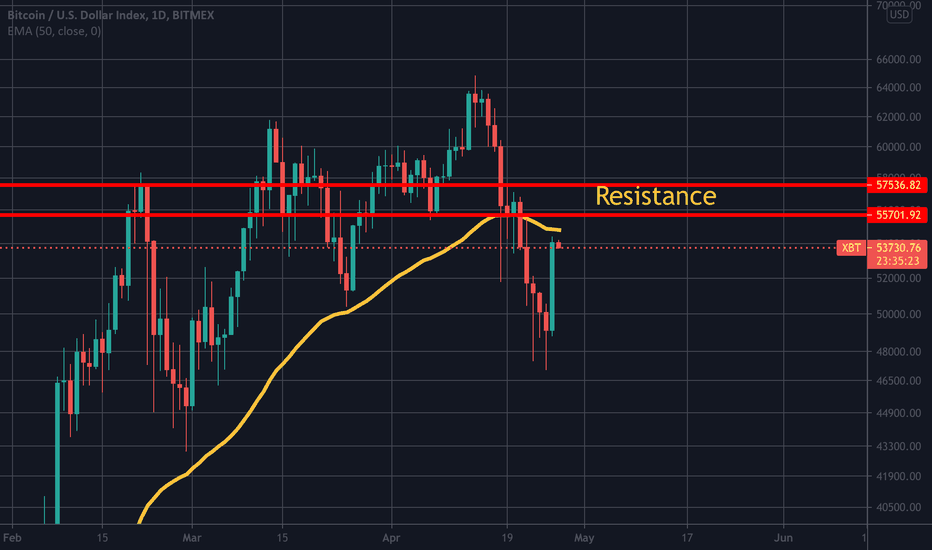
Daily Chart: Bearish Flag + Doji followed by confirmation Candle at 0.618 Fibonacci level. (Bearish)
Weekly Chart: Closing below Flat Top triangle for 2 weeks, and Bullish Engulfing after a Spinning Top and confirmation. (Neutral-Bullish)
Monthly Chart: Spinning Top after 13 months of Parabolic price move.
Change in Average Dollar Value of Trades: in the first 4 months of 2021 in comparison to the last 4 months of 2020.
Conclusion: Bearish is the most probable scenario.
Moshkelgosha
Educational Articles:
1-Triangle:
https://www.investopedia.com/articles/technical/03/091003.asp
2- Retracement vs reversal:
https://www.investopedia.com/articles/trading/06/retracements.asp
3- Fibonacci Retracement Levels:
https://www.investopedia.com/terms/f/fibonacciretracement.asp
4-Flag:
https://www.investopedia.com/terms/f/flag.asp
5- Bullish Engulfing:
https://www.investopedia.com/terms/b/bullishengulfingpattern.asp
6-Spinning Top:
https://www.investopedia.com/terms/s/spinning-top.asp
7- Parabolic uptrend:
https://www.investopedia.com/what-you-need-to-know-about-tesla-s-parabolic-uptrend-4784179

Use the following link to access trading ideas: patreon.com/SniperTraderStocks?utm_medium=unknown&utm_source=join_link&utm_campaign=creatorshare_creator&utm_content=copyLink
면책사항
해당 정보와 게시물은 금융, 투자, 트레이딩 또는 기타 유형의 조언이나 권장 사항으로 간주되지 않으며, 트레이딩뷰에서 제공하거나 보증하는 것이 아닙니다. 자세한 내용은 이용 약관을 참조하세요.
Use the following link to access trading ideas: patreon.com/SniperTraderStocks?utm_medium=unknown&utm_source=join_link&utm_campaign=creatorshare_creator&utm_content=copyLink
면책사항
해당 정보와 게시물은 금융, 투자, 트레이딩 또는 기타 유형의 조언이나 권장 사항으로 간주되지 않으며, 트레이딩뷰에서 제공하거나 보증하는 것이 아닙니다. 자세한 내용은 이용 약관을 참조하세요.