
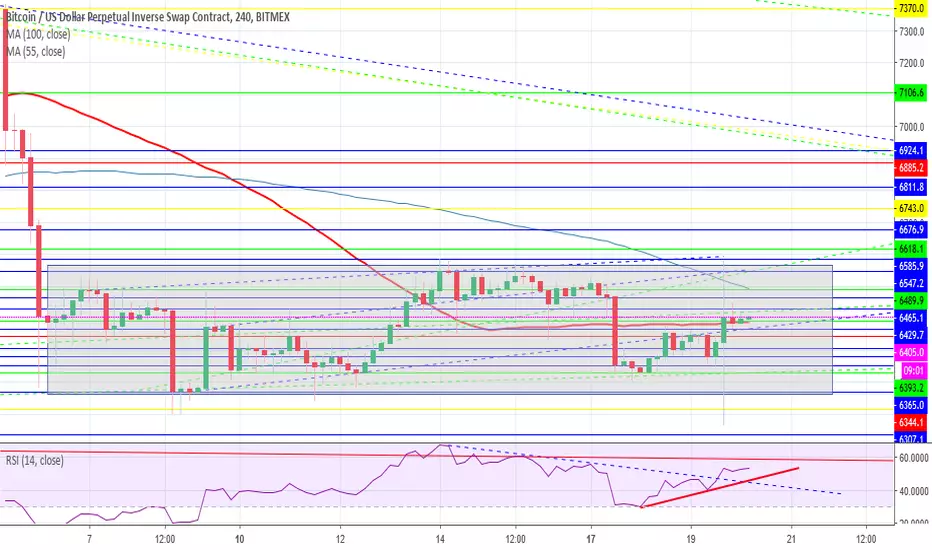
XBTUSD Technical Overview:
Pivot: $6342
Day Trading Range: $6250 - $6630
Key Resistance: $6410 - $6450 - $6520 - $6585 - $6620
Key Support: $6364 - $6338 - $6281 - $6230 - $6150
Technical Indicator:
Moving Average: Price is above SMA 55($6390) strong support & below SMA 100($6492) strong resistance for the day.
RSI: Indicator show upside bias, moving above 50 level.
Technical Trade Idea:
Most Likely Scenario Short below $6342 with target $6300 - $6250 in extension.
Alternative Scenario Long above $6342 with target $6450 - $6520 in extension.
Overall, XBTUSD price action the recent range-bound behavior has formed a bearish flag pattern. Bearish flag pole is around $1000 from the top to the bottom for the pole, should the bears breakout, could force Bitcoin doing to the $5500 territory.
Technically, given the mentioned flag patter formation, it does suggest XBTUSD could be vulnerable to a breakout to the downside. If playing by the textbook, the flag pole of the bearish flag is around $1000 in value, which could see a $1000 drop, should the bears pick up momentum and cause a breakout to the downside. Near-term support eyed at $6200-100. Resistance to the upside seen at the upper part of the flag and current range, $6600.
Thanks
YoCryptoManic
Pivot: $6342
Day Trading Range: $6250 - $6630
Key Resistance: $6410 - $6450 - $6520 - $6585 - $6620
Key Support: $6364 - $6338 - $6281 - $6230 - $6150
Technical Indicator:
Moving Average: Price is above SMA 55($6390) strong support & below SMA 100($6492) strong resistance for the day.
RSI: Indicator show upside bias, moving above 50 level.
Technical Trade Idea:
Most Likely Scenario Short below $6342 with target $6300 - $6250 in extension.
Alternative Scenario Long above $6342 with target $6450 - $6520 in extension.
Overall, XBTUSD price action the recent range-bound behavior has formed a bearish flag pattern. Bearish flag pole is around $1000 from the top to the bottom for the pole, should the bears breakout, could force Bitcoin doing to the $5500 territory.
Technically, given the mentioned flag patter formation, it does suggest XBTUSD could be vulnerable to a breakout to the downside. If playing by the textbook, the flag pole of the bearish flag is around $1000 in value, which could see a $1000 drop, should the bears pick up momentum and cause a breakout to the downside. Near-term support eyed at $6200-100. Resistance to the upside seen at the upper part of the flag and current range, $6600.
Thanks
YoCryptoManic

면책사항
해당 정보와 게시물은 금융, 투자, 트레이딩 또는 기타 유형의 조언이나 권장 사항으로 간주되지 않으며, 트레이딩뷰에서 제공하거나 보증하는 것이 아닙니다. 자세한 내용은 이용 약관을 참조하세요.
면책사항
해당 정보와 게시물은 금융, 투자, 트레이딩 또는 기타 유형의 조언이나 권장 사항으로 간주되지 않으며, 트레이딩뷰에서 제공하거나 보증하는 것이 아닙니다. 자세한 내용은 이용 약관을 참조하세요.