
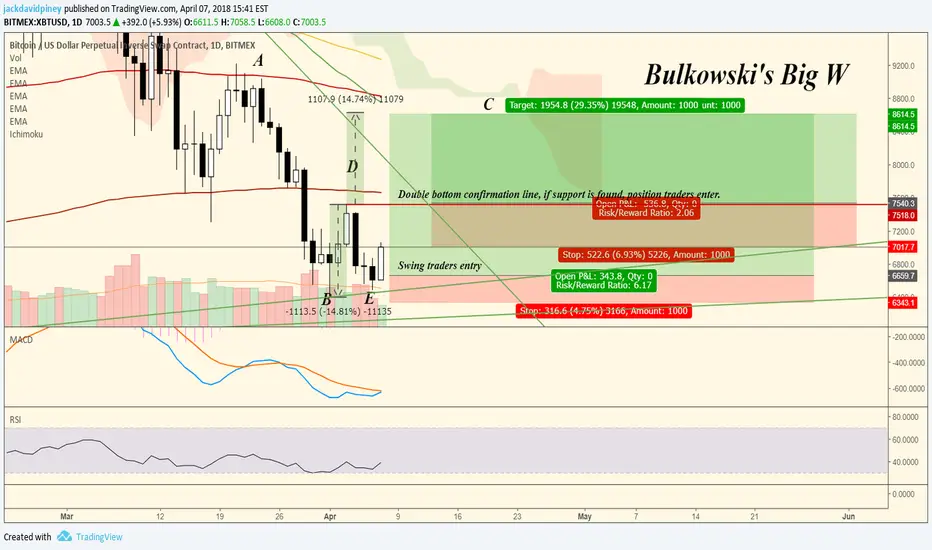
Bulkowski's Big W.
Keep in mind that we are in a long term down trend, making this riskier than usual. In fact I am bearish and short so this goes against my bias, but the possibility serves as an education for myself and documented specifically so I do not lose the chart. Enjoy.
Characteristic | Discussion
Price trend: Downward leading to the pattern.
Shape: A big W shape with twin bottoms and tall sides.
Reversal pattern: Look for a double bottom reversal pattern at the base of the big W.
Tall sides: The best performing big W chart patterns have tall, straight declines leading to the bottom of the big W.
Rise between bottoms: The rise between the valleys of the double bottom is 10% to 20% or more.
Volume: Recedes 69% of the time.
Breakout Confirmation: The pattern confirms as a valid one when price closes above the highest peak between the two bottoms.
Trading Tactic | Explanation.
Measure rule: Compute the height from the highest peak to the lowest valley (D-B) and then add the result to the price of the peak high D). The result is the target price. The link to the left gives more information about the measure rule.
Breakout: Occurs when price closes above the peak high (D).
Stall: For swing traders, buy at the double bottom low (E) and ride price upward to confirmation of the double bottom (the high between the two bottoms, D). Price often pauses there. If price drops below the low of the second bottom (E), exit the position immediately. If price confirms the double bottom, expect a rise approaching the left side high (A).
Position traders: Wait for confirmation of the double bottom before taking a position and be prepared to sell as the stock nears the price of the left side high (the price at C approaches the price at A).
See more from Bulkowski here: thepatternsite.com/bigw.html
In addition to the above and once again, against my bias. There is a possibility of an Adam and Eve Double Bottom here - Zoom Out:
thepatternsite.com/AdamEvePatterns.html
Keep in mind that we are in a long term down trend, making this riskier than usual. In fact I am bearish and short so this goes against my bias, but the possibility serves as an education for myself and documented specifically so I do not lose the chart. Enjoy.
Characteristic | Discussion
Price trend: Downward leading to the pattern.
Shape: A big W shape with twin bottoms and tall sides.
Reversal pattern: Look for a double bottom reversal pattern at the base of the big W.
Tall sides: The best performing big W chart patterns have tall, straight declines leading to the bottom of the big W.
Rise between bottoms: The rise between the valleys of the double bottom is 10% to 20% or more.
Volume: Recedes 69% of the time.
Breakout Confirmation: The pattern confirms as a valid one when price closes above the highest peak between the two bottoms.
Trading Tactic | Explanation.
Measure rule: Compute the height from the highest peak to the lowest valley (D-B) and then add the result to the price of the peak high D). The result is the target price. The link to the left gives more information about the measure rule.
Breakout: Occurs when price closes above the peak high (D).
Stall: For swing traders, buy at the double bottom low (E) and ride price upward to confirmation of the double bottom (the high between the two bottoms, D). Price often pauses there. If price drops below the low of the second bottom (E), exit the position immediately. If price confirms the double bottom, expect a rise approaching the left side high (A).
Position traders: Wait for confirmation of the double bottom before taking a position and be prepared to sell as the stock nears the price of the left side high (the price at C approaches the price at A).
See more from Bulkowski here: thepatternsite.com/bigw.html
In addition to the above and once again, against my bias. There is a possibility of an Adam and Eve Double Bottom here - Zoom Out:
thepatternsite.com/AdamEvePatterns.html
노트
A closer look at the fight.노트
Do we get our support?Anything less than 7400 is a failure for position traders waiting for entry.
노트
After finding daily support on the 300 EMA we are well on our way to the target.Due to the "Death Cross" of the 55 and 200 we have the 55 in the way but we are making great head way en-route to the 200 EMA and hitting our mark.
노트
Support above 7400 is crucial.Here's a look at the 4hr XBT
노트
Stop loss moved into happy profit region under strong supports which if broken would indicate further downside.매매 수동청산
It's my birthday tomorrow... today.I would like to enjoy the profits of the past few days so I have closed my position.
It is worth noting a possible swing high break of the daily and I'd rather not trade against the trend.

면책사항
해당 정보와 게시물은 금융, 투자, 트레이딩 또는 기타 유형의 조언이나 권장 사항으로 간주되지 않으며, 트레이딩뷰에서 제공하거나 보증하는 것이 아닙니다. 자세한 내용은 이용 약관을 참조하세요.
면책사항
해당 정보와 게시물은 금융, 투자, 트레이딩 또는 기타 유형의 조언이나 권장 사항으로 간주되지 않으며, 트레이딩뷰에서 제공하거나 보증하는 것이 아닙니다. 자세한 내용은 이용 약관을 참조하세요.