
The pull back of yesterday could be over!
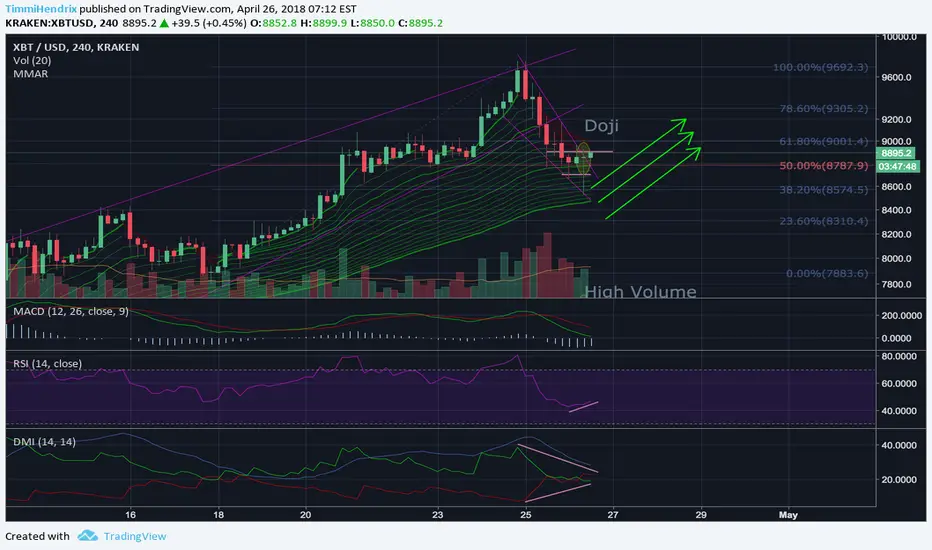
We see a huge Doji candle with a high volume which indicates a reversal. This Doji formed at 50% fibonacci level --> Bounce off this support level.
Additionaly we broke thru the down trend line of the falling wedge. This gives us also a signal to go long.
RSI stopped going down and shows us a consolidation. DMI shows gives us the same signal.
If we break thru the double bottom neckline on 30min Chart at 8900 we should expect a continuation of the uptrend for short term which will tell us if the up trend on 4h has enough power to go further.
Here the 30min Chart:

We see a huge Doji candle with a high volume which indicates a reversal. This Doji formed at 50% fibonacci level --> Bounce off this support level.
Additionaly we broke thru the down trend line of the falling wedge. This gives us also a signal to go long.
RSI stopped going down and shows us a consolidation. DMI shows gives us the same signal.
If we break thru the double bottom neckline on 30min Chart at 8900 we should expect a continuation of the uptrend for short term which will tell us if the up trend on 4h has enough power to go further.
Here the 30min Chart:
노트
It's on!If the this 30min candle closes above 8900 we're up again!
노트
Almost did it, but we're still on!
노트
Still in consolidation phase. Waiting for price action..노트
Seems like we're on track!노트
Next resistance @ 9600Can we break it?

면책사항
해당 정보와 게시물은 금융, 투자, 트레이딩 또는 기타 유형의 조언이나 권장 사항으로 간주되지 않으며, 트레이딩뷰에서 제공하거나 보증하는 것이 아닙니다. 자세한 내용은 이용 약관을 참조하세요.
면책사항
해당 정보와 게시물은 금융, 투자, 트레이딩 또는 기타 유형의 조언이나 권장 사항으로 간주되지 않으며, 트레이딩뷰에서 제공하거나 보증하는 것이 아닙니다. 자세한 내용은 이용 약관을 참조하세요.