숏
NEM Downside Correction
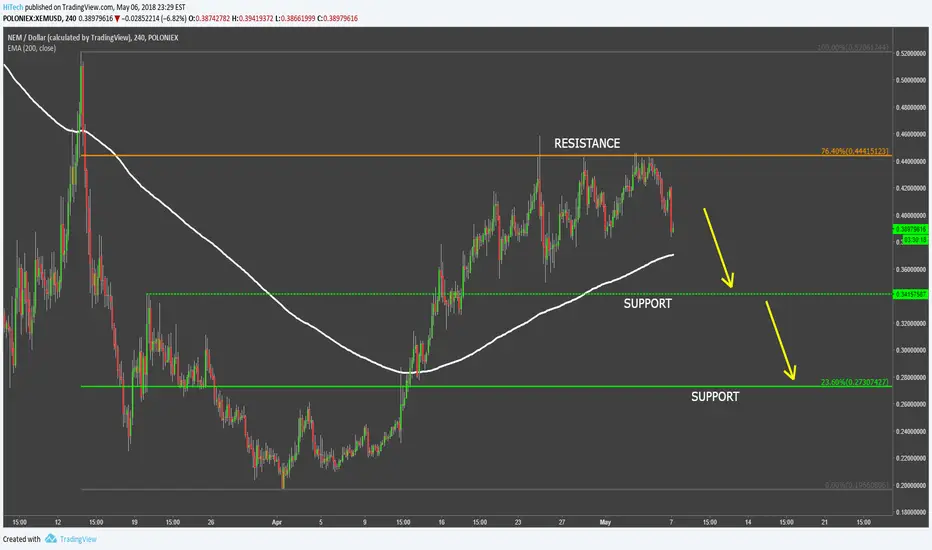
NEM has reached the high at $0.46 and then formed a strong resistance at the 76.4% Fibonacci retracement level, which is $0.44. The resistance has been rejected for tree consecutive times suggesting the corrective move down.
XEM/USD first downside target is seen at $0.34, where resistance was formed back on the 20th of March. Second support is based at 23.6% Fibs, that is $0.27 and this is the area where the 200 Moving Average was broken. It is important to watch these resistance levels for either a rejection of a breakout, but only break and close below the $0.27 could be a confirmation of a downtrend continuation.
On the upside, clearly the resistance at $0.44 in general and $0.46 level in particular must be broken, with the daily close above it. In that case the uptrend is likely to continue and could result in exponential growth.
XEM/USD first downside target is seen at $0.34, where resistance was formed back on the 20th of March. Second support is based at 23.6% Fibs, that is $0.27 and this is the area where the 200 Moving Average was broken. It is important to watch these resistance levels for either a rejection of a breakout, but only break and close below the $0.27 could be a confirmation of a downtrend continuation.
On the upside, clearly the resistance at $0.44 in general and $0.46 level in particular must be broken, with the daily close above it. In that case the uptrend is likely to continue and could result in exponential growth.
노트
NEM hitting the support... is it a reversal?거래청산: 타겟 닿음
거래청산: 타겟 닿음

면책사항
해당 정보와 게시물은 금융, 투자, 트레이딩 또는 기타 유형의 조언이나 권장 사항으로 간주되지 않으며, 트레이딩뷰에서 제공하거나 보증하는 것이 아닙니다. 자세한 내용은 이용 약관을 참조하세요.
면책사항
해당 정보와 게시물은 금융, 투자, 트레이딩 또는 기타 유형의 조언이나 권장 사항으로 간주되지 않으며, 트레이딩뷰에서 제공하거나 보증하는 것이 아닙니다. 자세한 내용은 이용 약관을 참조하세요.