업데이트됨
Update For XEM/USDT Analysis 📈📉
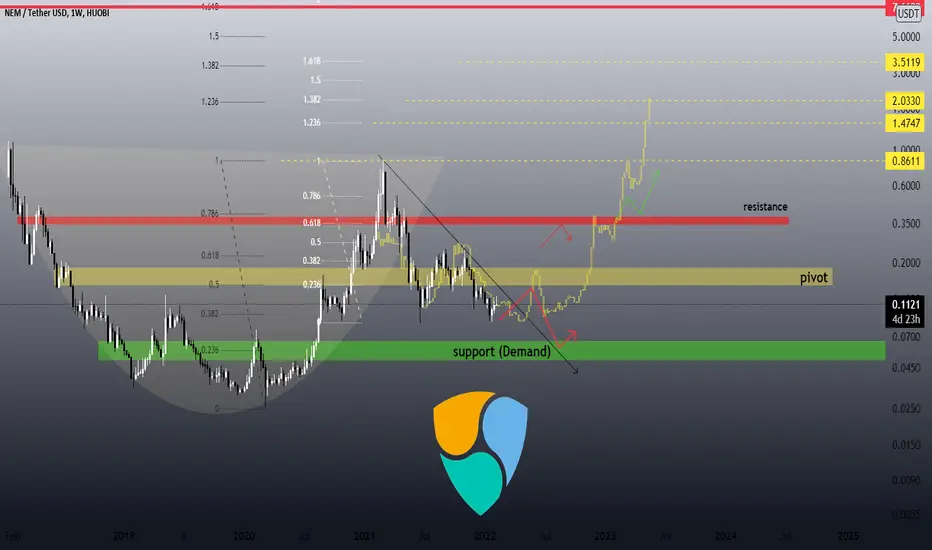
as we see in the WEEKLY timeframe for XEM/USDT since it reached highest price $0.866 ,it hasn't been successful to rise again to record a new higher high , the correction continued to 0.38 fibo level , after its recent downfall tried to close above pivot area but the selling pressure pulled it back below this range which is now a resistance zone , but its still under the descending trendline and can have further fall even to support area .
although the fractal view point shows us that we will have a bull run for NEM in the next months or year and it'll have very huge significant targets probably in this case .
but otherwise in view point of price action, if it not be able to break up pivot . it maybe return back to green support rang box again or being in side way for while.so it may fluctuate between higher and lower volume ranges zone .
🛑resistance level: $0.35 -$0.39
🆚pivot zone: $0.150-0.185$
❇️support levels: $0.05-0.0678
--------------------------------------------------------------------------------------------------------------------
👉This analysis is my personal opinion ,not a financial advice ,so do your own research.
💜 if you're a fan of my analyses PLZ follow me and give a big thumbs 👍 OR drop comment 🗯💭
액티브 트레이드
4H time frame:
관련 발행물
면책사항
해당 정보와 게시물은 금융, 투자, 트레이딩 또는 기타 유형의 조언이나 권장 사항으로 간주되지 않으며, 트레이딩뷰에서 제공하거나 보증하는 것이 아닙니다. 자세한 내용은 이용 약관을 참조하세요.
면책사항
해당 정보와 게시물은 금융, 투자, 트레이딩 또는 기타 유형의 조언이나 권장 사항으로 간주되지 않으며, 트레이딩뷰에서 제공하거나 보증하는 것이 아닙니다. 자세한 내용은 이용 약관을 참조하세요.