롱
XLM is Bullish
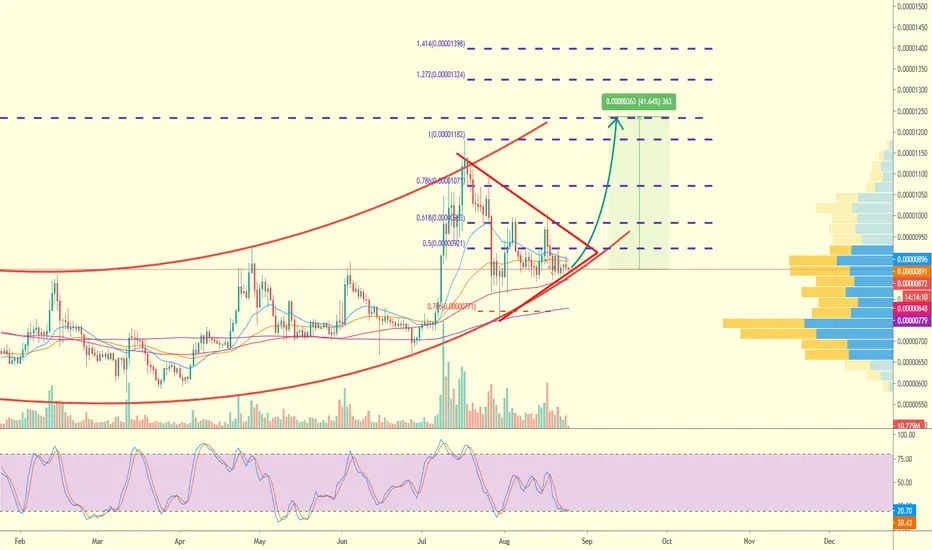
SWING TRADING ANALYSIS
XLM in the bullish channel(red lines) right know, it can higher because the volume of accumulation is high in currently price, you can see it from the spike of volume profile
The decreasing of volume is a sign that it will pump in a days
The oscilator showed the price is currenctly low, that means it is oversold right know
Trading plan :
Entry : 850 - 890
Target 1 : 1074
Target 2 : 1186
Target 3 : 1238
Target 4 : 1328
Stop loss : 800
Enjoy the profit later 🤑🤑🤑
XLM in the bullish channel(red lines) right know, it can higher because the volume of accumulation is high in currently price, you can see it from the spike of volume profile
The decreasing of volume is a sign that it will pump in a days
The oscilator showed the price is currenctly low, that means it is oversold right know
Trading plan :
Entry : 850 - 890
Target 1 : 1074
Target 2 : 1186
Target 3 : 1238
Target 4 : 1328
Stop loss : 800
Enjoy the profit later 🤑🤑🤑

면책사항
해당 정보와 게시물은 금융, 투자, 트레이딩 또는 기타 유형의 조언이나 권장 사항으로 간주되지 않으며, 트레이딩뷰에서 제공하거나 보증하는 것이 아닙니다. 자세한 내용은 이용 약관을 참조하세요.
면책사항
해당 정보와 게시물은 금융, 투자, 트레이딩 또는 기타 유형의 조언이나 권장 사항으로 간주되지 않으며, 트레이딩뷰에서 제공하거나 보증하는 것이 아닙니다. 자세한 내용은 이용 약관을 참조하세요.