
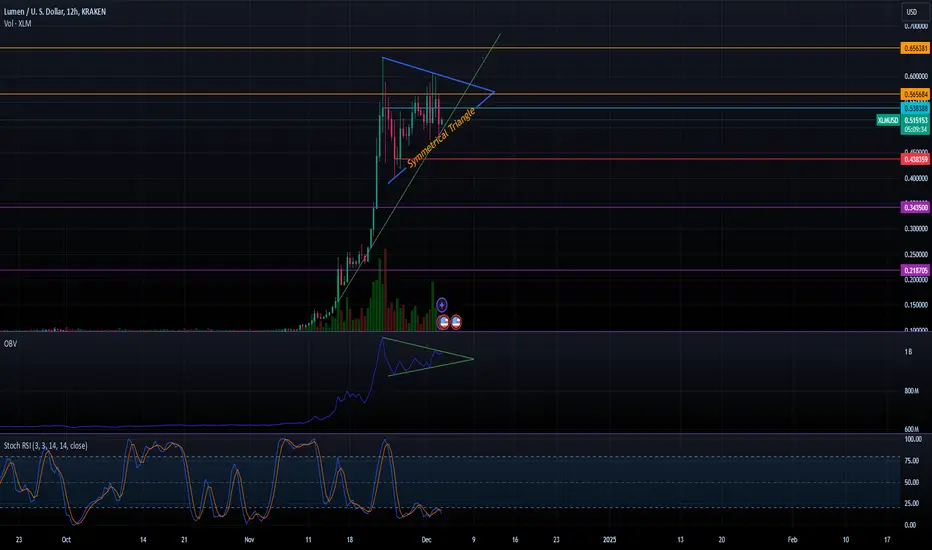
XLM is in consolidation with its sideways movement. The sideways movement seems to play within a symmetrical triangle with the ability to continue its upward trend. The 20ma and 200ma are still in play after its golden cross in early November. According to the Relative Strength Index (RSI), XLM is currently in an oversold condition. However, the On Balance Volume (OBV) shows that XLM has increased buy pressure as it's in price discovery. I believe it's finding new lows at a higher value before the break to new resistance levels. There are many bull signals, which makes me bullish on XLM.
Support - $0.43
Resistance - $0.56
Fear and Greed Index - 79 (80 = Extreme Greed; if the market hits extreme greed, be prepared to watch things moon.)
Support - $0.43
Resistance - $0.56
Fear and Greed Index - 79 (80 = Extreme Greed; if the market hits extreme greed, be prepared to watch things moon.)
액티브 트레이드
XLM has broken below the symmetrical triangle pattern, which could lead it to test key support levels. The Relative Strength Index (RSI) indicates that XLM is in oversold conditions, while the Commodity Channel Index (CCI) shows that XLM has dropped below -100, suggesting a potential rebound. Currently, XLM is testing its consolidation support level. It is only a matter of time before we may see a bounce to the upside, likely during the weekend or early next week.거래청산: 타겟 닿음
Obsverving the 4hr-chart and 12hr-chart.XLM is in a consolidation phase, testing key support levels around $0.44. On the 4-hour chart, the 20-period and 200-period moving averages are starting to converge, potentially reversing the golden cross that occurred on November 6th. On the 12-hour chart, the Rate of Change (ROC) indicator shows that XLM has been consolidating below the zero line since the beginning of December, but it is now beginning to break above that line. This suggests that XLM is likely to bounce to the upside soon.
Support - $0.34
Resistance - $0.51

면책사항
해당 정보와 게시물은 금융, 투자, 트레이딩 또는 기타 유형의 조언이나 권장 사항으로 간주되지 않으며, 트레이딩뷰에서 제공하거나 보증하는 것이 아닙니다. 자세한 내용은 이용 약관을 참조하세요.
면책사항
해당 정보와 게시물은 금융, 투자, 트레이딩 또는 기타 유형의 조언이나 권장 사항으로 간주되지 않으며, 트레이딩뷰에서 제공하거나 보증하는 것이 아닙니다. 자세한 내용은 이용 약관을 참조하세요.