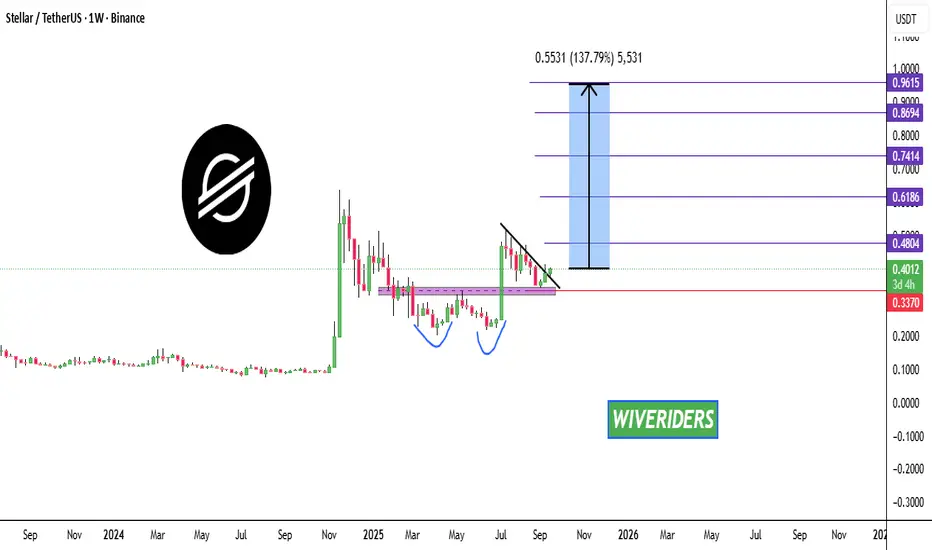
📊  XLM Weekly Market Update – Long Setup
As we can see on the weekly chart,XLM has formed a bullish double bottom pattern ✅
👉 After the pullback, it broke out of the black resistance zone, confirming a bullish structure.
🔼 Trade Idea:
📈 Entry Price (Current): 0.4002
🎯 Targets:
Target 1 → 0.4804
Target 2 → 0.6186
Target 3 → 0.7414
Target 4 → 0.8694
Target 5 → 0.9615
🛑 Stop Loss: 0.3370
⚠️ Risk: ~15.80%
💰 Potential Reward: ~140.19%
📊 Risk/Reward Ratio: ~8.87
📌 Trade Type: Long
👉 If you’re holdingXLM, these are the weekly targets & stop-loss to watch.
XLM Weekly Market Update – Long SetupAs we can see on the weekly chart,
XLM has formed a bullish double bottom pattern ✅👉 After the pullback, it broke out of the black resistance zone, confirming a bullish structure.
🔼 Trade Idea:
📈 Entry Price (Current): 0.4002
🎯 Targets:
Target 1 → 0.4804
Target 2 → 0.6186
Target 3 → 0.7414
Target 4 → 0.8694
Target 5 → 0.9615
🛑 Stop Loss: 0.3370
⚠️ Risk: ~15.80%
💰 Potential Reward: ~140.19%
📊 Risk/Reward Ratio: ~8.87
📌 Trade Type: Long
👉 If you’re holding
XLM, these are the weekly targets & stop-loss to watch.
면책사항
해당 정보와 게시물은 금융, 투자, 트레이딩 또는 기타 유형의 조언이나 권장 사항으로 간주되지 않으며, 트레이딩뷰에서 제공하거나 보증하는 것이 아닙니다. 자세한 내용은 이용 약관을 참조하세요.
면책사항
해당 정보와 게시물은 금융, 투자, 트레이딩 또는 기타 유형의 조언이나 권장 사항으로 간주되지 않으며, 트레이딩뷰에서 제공하거나 보증하는 것이 아닙니다. 자세한 내용은 이용 약관을 참조하세요.