
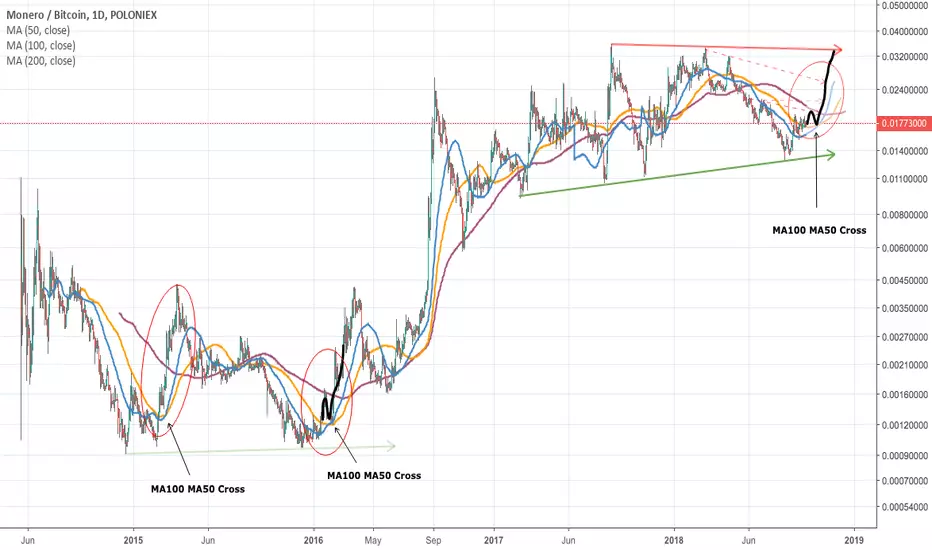
Gentlemen, every time we saw MA200, MA100, MA50 on a top-bottom sequence forming over the chart, it has produced a strong bullish move; it happened before in Jan/Feb ’15, Jan/Feb ’16 and now it’s happening again.
When we look back to Jan/Feb ’16 MA200, MA100 & MA50 we see a very similar scenario. The chart starts ascending breaking both MA50 & MA100 till it hits back when meeting MA200, onwards while its descending both the MA50 and the MA100 form a crossing support giving a stronger attempt to break the MA200.
Targets are:
0.0194
0.0214
0.0253
0.0326
-- small request: Like the chart to receive updates and provide me with insights as i don't usually make Monero charts :)
Good luck with your trades
When we look back to Jan/Feb ’16 MA200, MA100 & MA50 we see a very similar scenario. The chart starts ascending breaking both MA50 & MA100 till it hits back when meeting MA200, onwards while its descending both the MA50 and the MA100 form a crossing support giving a stronger attempt to break the MA200.
Targets are:
0.0194
0.0214
0.0253
0.0326
-- small request: Like the chart to receive updates and provide me with insights as i don't usually make Monero charts :)
Good luck with your trades

면책사항
해당 정보와 게시물은 금융, 투자, 트레이딩 또는 기타 유형의 조언이나 권장 사항으로 간주되지 않으며, 트레이딩뷰에서 제공하거나 보증하는 것이 아닙니다. 자세한 내용은 이용 약관을 참조하세요.
면책사항
해당 정보와 게시물은 금융, 투자, 트레이딩 또는 기타 유형의 조언이나 권장 사항으로 간주되지 않으며, 트레이딩뷰에서 제공하거나 보증하는 것이 아닙니다. 자세한 내용은 이용 약관을 참조하세요.