
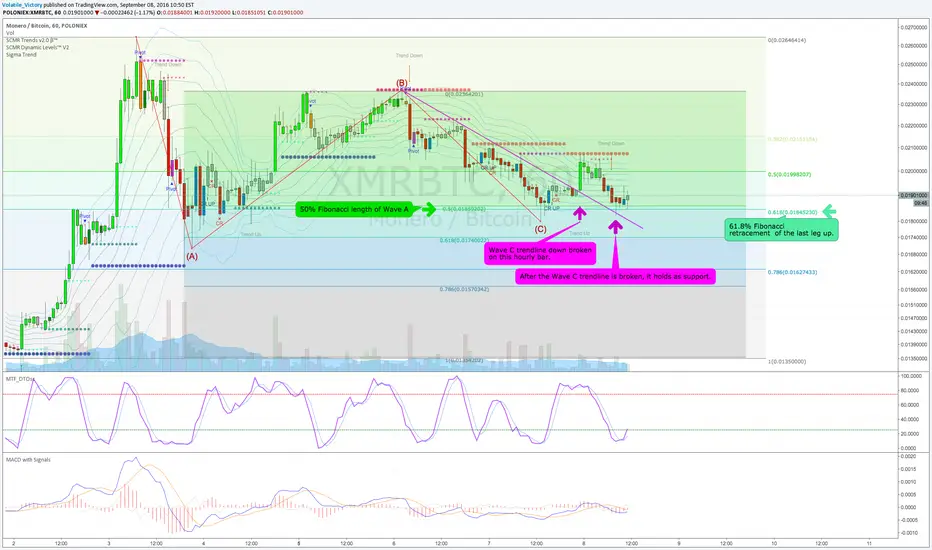
All signs point to the XMRBTC correction being over:
1. Notice the ABC wave correction.
2. Wave C is equal to Wave A which is a common length of a Wave C to Wave A.
3. Wave C retraced back 61.8% of the previous impulsive leg up.
4. The Wave C trendline was broken on Sept 7th at 03:00 UTC (23:00 EST on graph).
5. The Wave C trendline, after being broken, held as resistance at 12:00 UTC (08:00 EST on graph)
All of those signals point to the last move off the ATH as being a temporary correction and that we can expect another move higher. I would go LONG XMRBTC and place a stop at 0.0180. If when the next hourly RSI is rolling over and we have not significantly pushed past at least 0.0220 then I would be concerned that another pattern may be playing out instead of an immediate push to a new ATH.

면책사항
해당 정보와 게시물은 금융, 투자, 트레이딩 또는 기타 유형의 조언이나 권장 사항으로 간주되지 않으며, 트레이딩뷰에서 제공하거나 보증하는 것이 아닙니다. 자세한 내용은 이용 약관을 참조하세요.
면책사항
해당 정보와 게시물은 금융, 투자, 트레이딩 또는 기타 유형의 조언이나 권장 사항으로 간주되지 않으며, 트레이딩뷰에서 제공하거나 보증하는 것이 아닙니다. 자세한 내용은 이용 약관을 참조하세요.