XMRUSDT H1
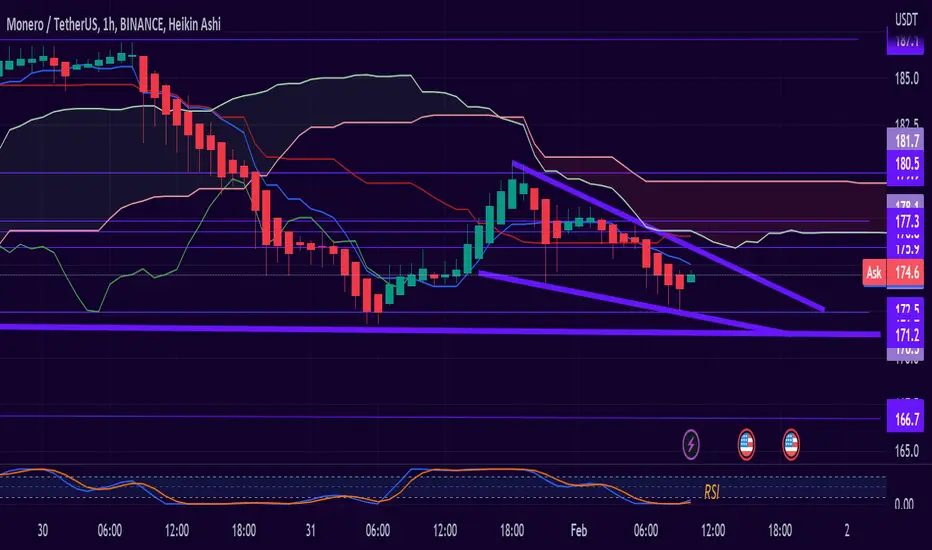
Looking at the short-term H1 chart, my overall bias for XMRUSDT is bearish due to the current price being below the Ichimoku cloud, indicating a bear market.
As the RSI shows the exhaustion of selling forces , a limit buy entry at 171.22 where it would make a triple bottom and the support of the lower line of the Keltner Channel .
Key support levels: 171.2 / 166.7
Main Resistance Levels: 175.9 / 179.9
✅RSI: Exhaustion of selling forces.
✅MM200: At the height of 177.3
As the RSI shows the exhaustion of selling forces , a limit buy entry at 171.22 where it would make a triple bottom and the support of the lower line of the Keltner Channel .
Key support levels: 171.2 / 166.7
Main Resistance Levels: 175.9 / 179.9
✅RSI: Exhaustion of selling forces.
✅MM200: At the height of 177.3

Renato Ulianov | Market Analysis & Trading
YouTube: youtube.com/@TradewithRenatoUlianov
Disclaimer: All content is for educational and informational purposes only and does not constitute financial advice.
YouTube: youtube.com/@TradewithRenatoUlianov
Disclaimer: All content is for educational and informational purposes only and does not constitute financial advice.
면책사항
해당 정보와 게시물은 금융, 투자, 트레이딩 또는 기타 유형의 조언이나 권장 사항으로 간주되지 않으며, 트레이딩뷰에서 제공하거나 보증하는 것이 아닙니다. 자세한 내용은 이용 약관을 참조하세요.
Renato Ulianov | Market Analysis & Trading
YouTube: youtube.com/@TradewithRenatoUlianov
Disclaimer: All content is for educational and informational purposes only and does not constitute financial advice.
YouTube: youtube.com/@TradewithRenatoUlianov
Disclaimer: All content is for educational and informational purposes only and does not constitute financial advice.
면책사항
해당 정보와 게시물은 금융, 투자, 트레이딩 또는 기타 유형의 조언이나 권장 사항으로 간주되지 않으며, 트레이딩뷰에서 제공하거나 보증하는 것이 아닙니다. 자세한 내용은 이용 약관을 참조하세요.