
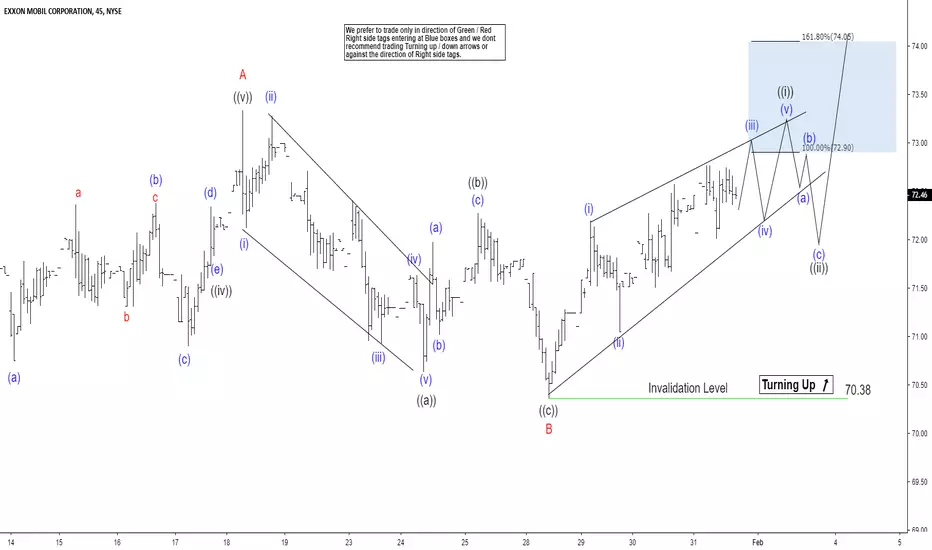
Elliott Wave view in Exxon Mobil (ticker: XOM) suggests that the rally from December 26, 2018 low ($64.65) is unfolding as Elliott Wave zigzag. The first leg of the zigzag ended at $73.33 on January 18, 2019 high as wave A. A zigzag is a 5-3-5 structure and wave A should unfold in 5 waves in impulse or diagonal. We can see in the chart below that wave ((iii)) of A ended at $73, wave ((iv)) of A ended at $71.95, and wave ((v)) of A ended at $73.33.
The stock then pullback in wave B with the internal as a zigzag Elliott Wave structure as well. Down from $73.33, wave ((a)) ended at $70.64, wave ((b)) ended at $72.27, and wave ((c)) ended at $70.37. Wave C rally has started and the stock is expected to break above wave A at $73 and could see as high as $79 when wave A = C. To gain confirmation for this view, the stock still needs to break above $73. Otherwise, technically we still can’t rule out a double correction in wave B. Near term, while pullback stays above $73.33, expect Exxon Mobil to extend higher.
The stock then pullback in wave B with the internal as a zigzag Elliott Wave structure as well. Down from $73.33, wave ((a)) ended at $70.64, wave ((b)) ended at $72.27, and wave ((c)) ended at $70.37. Wave C rally has started and the stock is expected to break above wave A at $73 and could see as high as $79 when wave A = C. To gain confirmation for this view, the stock still needs to break above $73. Otherwise, technically we still can’t rule out a double correction in wave B. Near term, while pullback stays above $73.33, expect Exxon Mobil to extend higher.

14 days trial --> elliottwave-forecast.com/plan-trial/ and get Accurate & timely Elliott Wave Forecasts of 78 instruments. Webinars, Chat Room, Stocks/Forex/Indices Signals & more.
면책사항
해당 정보와 게시물은 금융, 투자, 트레이딩 또는 기타 유형의 조언이나 권장 사항으로 간주되지 않으며, 트레이딩뷰에서 제공하거나 보증하는 것이 아닙니다. 자세한 내용은 이용 약관을 참조하세요.
14 days trial --> elliottwave-forecast.com/plan-trial/ and get Accurate & timely Elliott Wave Forecasts of 78 instruments. Webinars, Chat Room, Stocks/Forex/Indices Signals & more.
면책사항
해당 정보와 게시물은 금융, 투자, 트레이딩 또는 기타 유형의 조언이나 권장 사항으로 간주되지 않으며, 트레이딩뷰에서 제공하거나 보증하는 것이 아닙니다. 자세한 내용은 이용 약관을 참조하세요.