
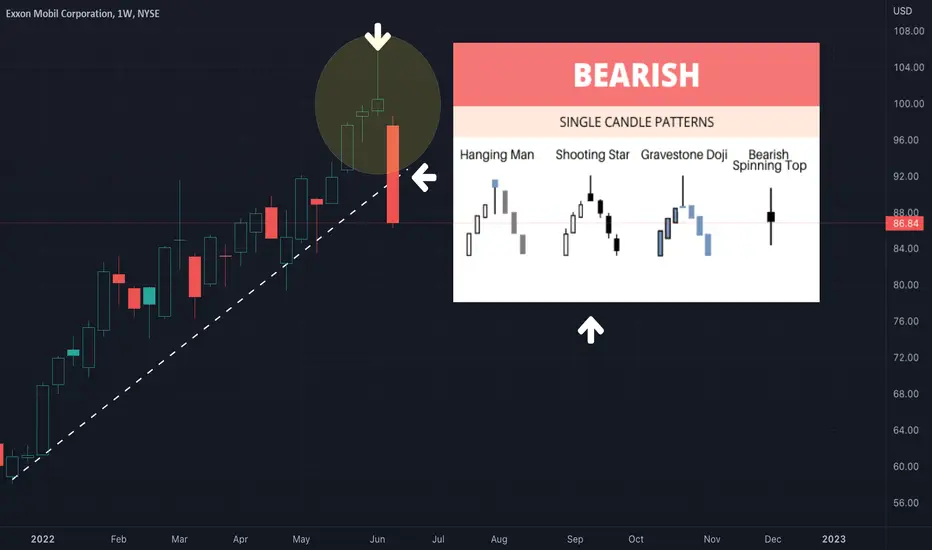
The weekly candles for the oil and gas company, ExxonMobil, look quite bearish. This could be the start of a major decline. There is a shooting star pattern forming on the weekly chart, while the oscillators are trending down and while the daily EMA exp ribbon and daily trend lines breaking down. Although anything can happen, it is looking like a major bearish reversal is occurring. It's sad that just last week all the "expert analysts" at CNBC were making strong bullish calls about energy stocks, citing "free cash flow" and numerous other reasons to buy them, all the while the charts are showing a topping pattern in energy and commodities. This is usually when tops form - when there is no bearish sentiment among anyone, and when strong hands are selling to weak hands. At least charts do not lie, and thanks to TradingView anyone can access them alongside a plethora of crowd-sourced scripts and indicators.
노트

면책사항
해당 정보와 게시물은 금융, 투자, 트레이딩 또는 기타 유형의 조언이나 권장 사항으로 간주되지 않으며, 트레이딩뷰에서 제공하거나 보증하는 것이 아닙니다. 자세한 내용은 이용 약관을 참조하세요.
면책사항
해당 정보와 게시물은 금융, 투자, 트레이딩 또는 기타 유형의 조언이나 권장 사항으로 간주되지 않으며, 트레이딩뷰에서 제공하거나 보증하는 것이 아닙니다. 자세한 내용은 이용 약관을 참조하세요.