
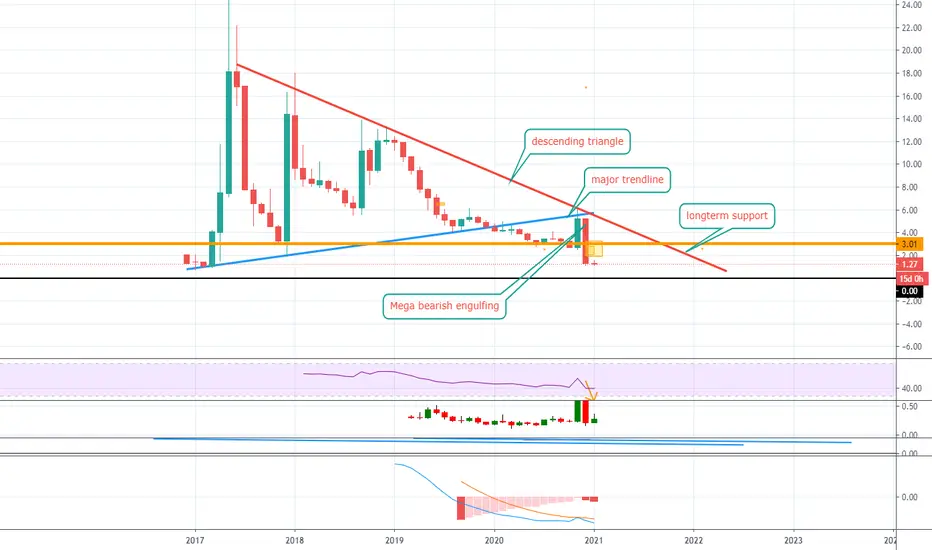
Never saw a more bearish chart and this is the monthly. Here goes:
-Dom rejected from descending triangle resistance.
-Dom fell under long-term rising trendline
-Dom monthly closed way below major longterm horizontal support.
-Mega bearish engulfing monthly candle, almost 70% larger than the bullish candle.
-MACD has been in the red forever.
How is bullish?
-Dom rejected from descending triangle resistance.
-Dom fell under long-term rising trendline
-Dom monthly closed way below major longterm horizontal support.
-Mega bearish engulfing monthly candle, almost 70% larger than the bullish candle.
-MACD has been in the red forever.
How is bullish?

관련 발행물
면책사항
해당 정보와 게시물은 금융, 투자, 트레이딩 또는 기타 유형의 조언이나 권장 사항으로 간주되지 않으며, 트레이딩뷰에서 제공하거나 보증하는 것이 아닙니다. 자세한 내용은 이용 약관을 참조하세요.
관련 발행물
면책사항
해당 정보와 게시물은 금융, 투자, 트레이딩 또는 기타 유형의 조언이나 권장 사항으로 간주되지 않으며, 트레이딩뷰에서 제공하거나 보증하는 것이 아닙니다. 자세한 내용은 이용 약관을 참조하세요.