
Observations:
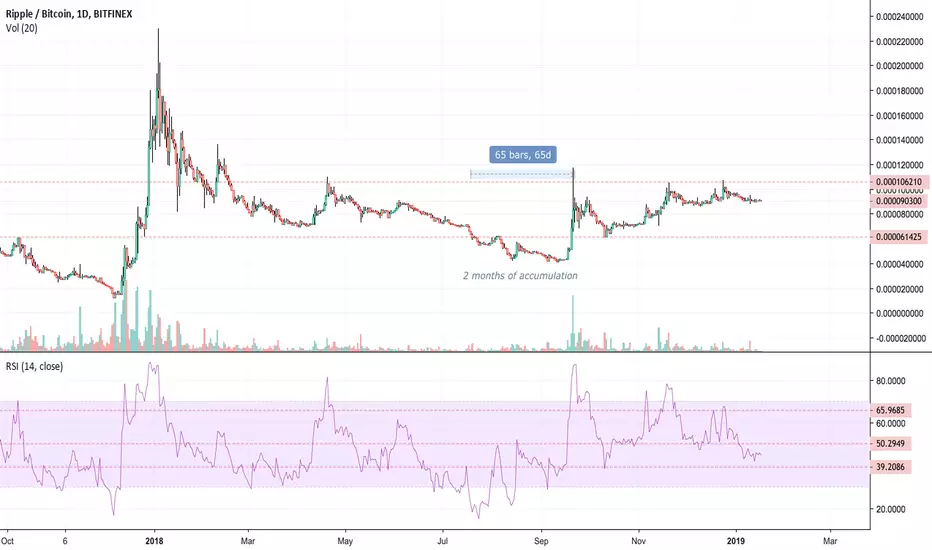
XRP/BTC was in a downtrend for some time, spent about 2 months in what looks like accumulation, broke out of that on high buying volume (that was very much a whale move disguised under the pretext of a 'buy the rumour sell the news' event) and is now trading in a range that mirrors the swing highs and lows of the original downtrend.
Wild speculations:
+ While Ripple is always impacted by Bitcoin, it does look like a chart that has ended it's bear market and is consolidating before a big move. It will most likely range for some time before deciding on a direction. Shorting or longing the top or bottom of this range would probably give you good profits, much like a Forex chart.
+ Ripple could surprise us by showing bullish moves even in the midst of Bitcoin's continued macro downtrend. There's enough hype around it as a rival to Bitcoin that I can imagine whales could manipulate the price to suck in more retail money on independent moves from BTC (this is not based on the chart but merely my own bias and interpretation).
+ It would be interesting to compare this XRP chart with Bitcoin's ultimate trajectory. I wonder if alts such as this are a leading indicator of where Bitcoin will ultimately move. If so, it would indicate we'll see more drawdown in BTC before it starts ranging in a region of 83%-85%. If we had a 2000 bottom for BTC, that would create a range of 2000-3700. Or 3000-5500. This seems like a fair bet for 2019-2020.
Chart analysed: XRP/BTC Daily
Indicators: RSI, Support/Resistance, Volume
XRP/BTC was in a downtrend for some time, spent about 2 months in what looks like accumulation, broke out of that on high buying volume (that was very much a whale move disguised under the pretext of a 'buy the rumour sell the news' event) and is now trading in a range that mirrors the swing highs and lows of the original downtrend.
Wild speculations:
+ While Ripple is always impacted by Bitcoin, it does look like a chart that has ended it's bear market and is consolidating before a big move. It will most likely range for some time before deciding on a direction. Shorting or longing the top or bottom of this range would probably give you good profits, much like a Forex chart.
+ Ripple could surprise us by showing bullish moves even in the midst of Bitcoin's continued macro downtrend. There's enough hype around it as a rival to Bitcoin that I can imagine whales could manipulate the price to suck in more retail money on independent moves from BTC (this is not based on the chart but merely my own bias and interpretation).
+ It would be interesting to compare this XRP chart with Bitcoin's ultimate trajectory. I wonder if alts such as this are a leading indicator of where Bitcoin will ultimately move. If so, it would indicate we'll see more drawdown in BTC before it starts ranging in a region of 83%-85%. If we had a 2000 bottom for BTC, that would create a range of 2000-3700. Or 3000-5500. This seems like a fair bet for 2019-2020.
Chart analysed: XRP/BTC Daily
Indicators: RSI, Support/Resistance, Volume

면책사항
해당 정보와 게시물은 금융, 투자, 트레이딩 또는 기타 유형의 조언이나 권장 사항으로 간주되지 않으며, 트레이딩뷰에서 제공하거나 보증하는 것이 아닙니다. 자세한 내용은 이용 약관을 참조하세요.
면책사항
해당 정보와 게시물은 금융, 투자, 트레이딩 또는 기타 유형의 조언이나 권장 사항으로 간주되지 않으며, 트레이딩뷰에서 제공하거나 보증하는 것이 아닙니다. 자세한 내용은 이용 약관을 참조하세요.