
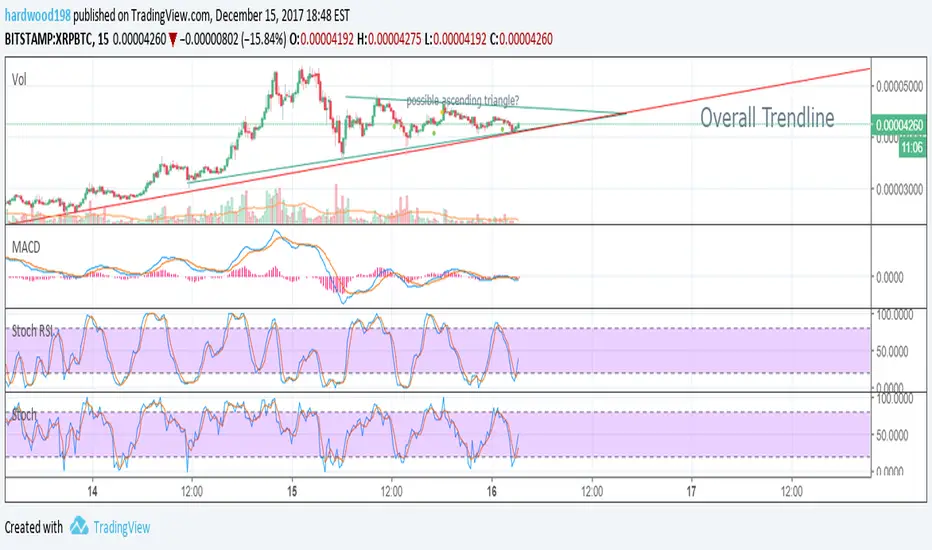
1. Overall trendline upwards -> Trend should continue
2. Possible ascending triangle -> Sign of bullish market and possible breakout soon
3. MACD, RSI, Stochastic indicators all in favour of upward trend
Enter the market using the green line, set stop loss below the red line. If price drops below red line, indicates possible trend reversal. Can be conservative and take profit once upper green line is reached.
Looks like ripple set to continue increasing, at least for the next day or so! Hopefully breakout occurs and price further increases.
GL with trading!
2. Possible ascending triangle -> Sign of bullish market and possible breakout soon
3. MACD, RSI, Stochastic indicators all in favour of upward trend
Enter the market using the green line, set stop loss below the red line. If price drops below red line, indicates possible trend reversal. Can be conservative and take profit once upper green line is reached.
Looks like ripple set to continue increasing, at least for the next day or so! Hopefully breakout occurs and price further increases.
GL with trading!

면책사항
해당 정보와 게시물은 금융, 투자, 트레이딩 또는 기타 유형의 조언이나 권장 사항으로 간주되지 않으며, 트레이딩뷰에서 제공하거나 보증하는 것이 아닙니다. 자세한 내용은 이용 약관을 참조하세요.
면책사항
해당 정보와 게시물은 금융, 투자, 트레이딩 또는 기타 유형의 조언이나 권장 사항으로 간주되지 않으며, 트레이딩뷰에서 제공하거나 보증하는 것이 아닙니다. 자세한 내용은 이용 약관을 참조하세요.