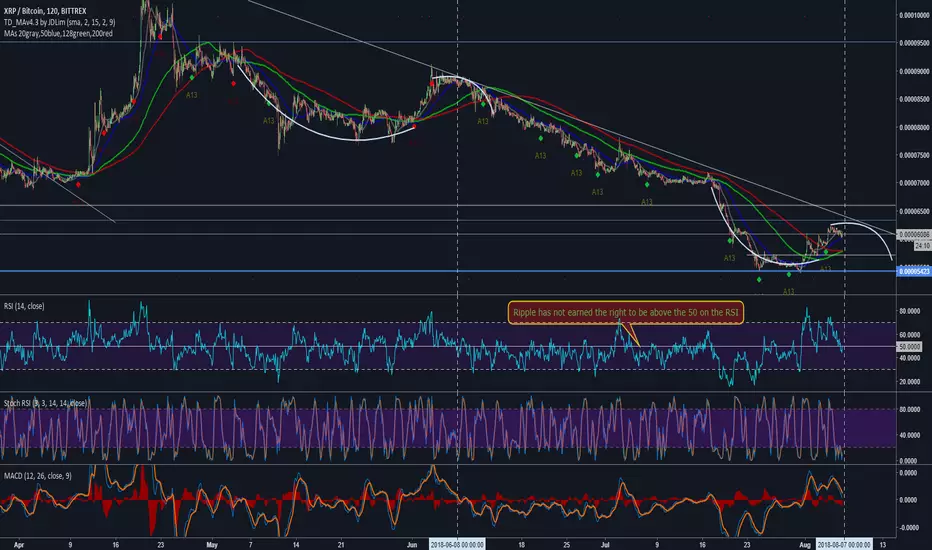
You are looking at the 2hr chart for XRP for a combined data look...
Overlook the Moving Averages you see (part of the template I use), they have very little meaning with ripple token.
I am finding many similarities in the TA the further I look into cripple. The white vertical lines represent where I think ripple is repeating its own history. I have more analysis and will post here. If interested in seeing more in depth TA on this token just leave a comment. I've got some more interesting stuff I've found with Fib patterns
While you're there in the comments, give me a reason to be optimistic about this token. Give me a reason why ripple should hold strength above the 50 on the RSI and -0- of the MACD for extended periods of time. I'll be waiting to hear from you...
Overlook the Moving Averages you see (part of the template I use), they have very little meaning with ripple token.
I am finding many similarities in the TA the further I look into cripple. The white vertical lines represent where I think ripple is repeating its own history. I have more analysis and will post here. If interested in seeing more in depth TA on this token just leave a comment. I've got some more interesting stuff I've found with Fib patterns
While you're there in the comments, give me a reason to be optimistic about this token. Give me a reason why ripple should hold strength above the 50 on the RSI and -0- of the MACD for extended periods of time. I'll be waiting to hear from you...

면책사항
해당 정보와 게시물은 금융, 투자, 트레이딩 또는 기타 유형의 조언이나 권장 사항으로 간주되지 않으며, 트레이딩뷰에서 제공하거나 보증하는 것이 아닙니다. 자세한 내용은 이용 약관을 참조하세요.
면책사항
해당 정보와 게시물은 금융, 투자, 트레이딩 또는 기타 유형의 조언이나 권장 사항으로 간주되지 않으며, 트레이딩뷰에서 제공하거나 보증하는 것이 아닙니다. 자세한 내용은 이용 약관을 참조하세요.