 XRPUSD
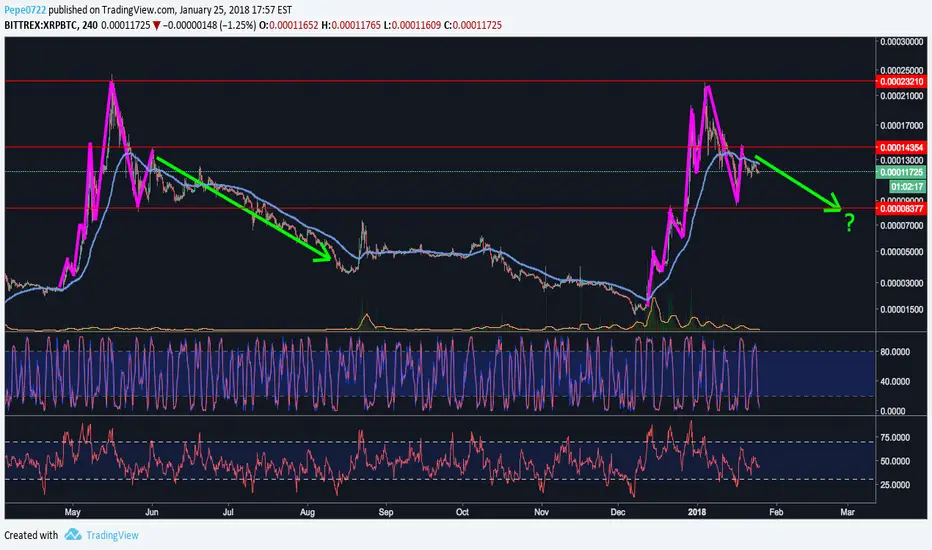
I was analyzing what is happening with XRP and I found this seeing XRP/BTC chart.
I have to say that I´m bullish on XRP and actually I´m trading a long position since last week.
But have to say that this really caught my attention as it has a lot of similitude with the development the pair had in the past and it has being using some of the main support/resistances now to form what seems to be an almost exact figure.
If this continue to run as in the past, it is suggesting that XRP will go even lower than last week. In the other hand, analyzing XRP/USD we have some bullish signals that are at stake and will be more clear within the next 2 days to confirm a new uptrend or a continuation of the downtrend, whatever XRP does, I will be posting further analysis and updates.
Stay tunned

면책사항
해당 정보와 게시물은 금융, 투자, 트레이딩 또는 기타 유형의 조언이나 권장 사항으로 간주되지 않으며, 트레이딩뷰에서 제공하거나 보증하는 것이 아닙니다. 자세한 내용은 이용 약관을 참조하세요.
면책사항
해당 정보와 게시물은 금융, 투자, 트레이딩 또는 기타 유형의 조언이나 권장 사항으로 간주되지 않으며, 트레이딩뷰에서 제공하거나 보증하는 것이 아닙니다. 자세한 내용은 이용 약관을 참조하세요.