
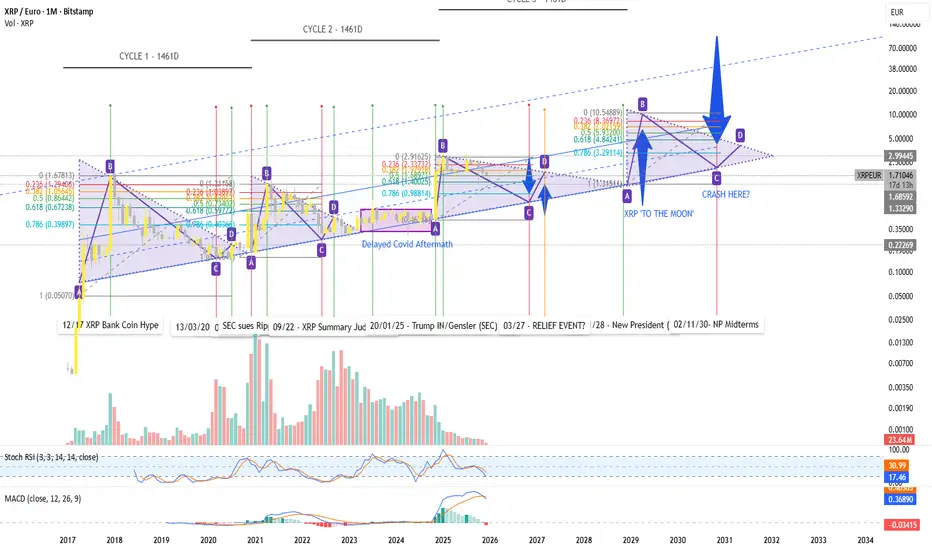
The chart maps XRP from 2017 to 2030 on a monthly timeframe.
Key external events (legal, macroeconomic, political) are explicitly marked.
Green vertical lines indicate cyclical tops, while red vertical lines indicate cyclical bottoms.
Price action develops within a clearly defined long-term ascending channel, which has been respected across multiple cycles.
Each cycle unfolds through a triangle consolidation pattern, followed by an impulse move and a corrective phase.
Fibonacci retracements are included to visualize the relationship between impulsive and corrective moves; prior corrections repeatedly align with the 0.618–0.786 levels.
The time cycles of 1,461 days (4 years) remain consistent throughout the chart, indicating a stable cyclical rhythm.
Based on time structure and pattern repetition, a cyclical endpoint is projected around 2029–2030, coinciding with a broader macroeconomic reset period.
Key external events (legal, macroeconomic, political) are explicitly marked.
Green vertical lines indicate cyclical tops, while red vertical lines indicate cyclical bottoms.
Price action develops within a clearly defined long-term ascending channel, which has been respected across multiple cycles.
Each cycle unfolds through a triangle consolidation pattern, followed by an impulse move and a corrective phase.
Fibonacci retracements are included to visualize the relationship between impulsive and corrective moves; prior corrections repeatedly align with the 0.618–0.786 levels.
The time cycles of 1,461 days (4 years) remain consistent throughout the chart, indicating a stable cyclical rhythm.
Based on time structure and pattern repetition, a cyclical endpoint is projected around 2029–2030, coinciding with a broader macroeconomic reset period.

면책사항
해당 정보와 게시물은 금융, 투자, 트레이딩 또는 기타 유형의 조언이나 권장 사항으로 간주되지 않으며, 트레이딩뷰에서 제공하거나 보증하는 것이 아닙니다. 자세한 내용은 이용 약관을 참조하세요.
면책사항
해당 정보와 게시물은 금융, 투자, 트레이딩 또는 기타 유형의 조언이나 권장 사항으로 간주되지 않으며, 트레이딩뷰에서 제공하거나 보증하는 것이 아닙니다. 자세한 내용은 이용 약관을 참조하세요.