
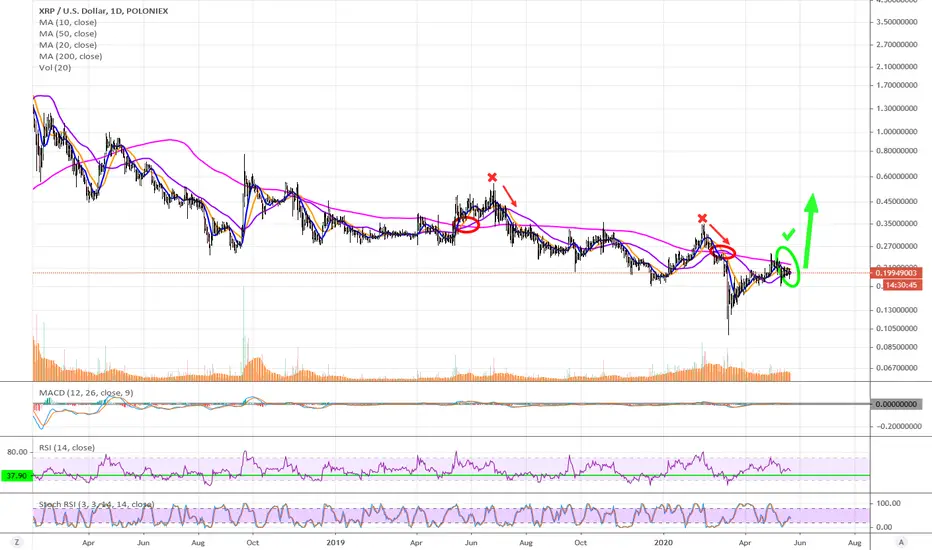
This is a daily view on XRP
I am drawing attention to the most common "golden cross" in charting: when the 50 SMA crosses above the 200 SMA
What I am specifically drawing attention to is the following:
- During our prior 2017 bull-run, it took the 3rd golden cross to enter our bull market (SHOWN BELOW)
- The first 2 golden crosses (red circles) resulted in prices rising above the 200 SMA, but then ultimately rejecting and crossing back below the 200 SMA (red 'x' failure, and red arrow move back down)
- The 3rd golden cross (green circle) resulted in prices sky rocketing, entering our bull market (green check mark, and green arrow up)
The same sort of fractal may be playing out in 2020:
- I have indicated the same first 2 golden cross failures in 2020
- I have also drawn what appears to be our 3rd upcoming golden cross. So this begs the question: Will we similar price reaction and the start of our new bull market in XRP
Please look at the chart BELOW, and the chart ABOVE and observe the similarities
I am drawing attention to the most common "golden cross" in charting: when the 50 SMA crosses above the 200 SMA
What I am specifically drawing attention to is the following:
- During our prior 2017 bull-run, it took the 3rd golden cross to enter our bull market (SHOWN BELOW)
- The first 2 golden crosses (red circles) resulted in prices rising above the 200 SMA, but then ultimately rejecting and crossing back below the 200 SMA (red 'x' failure, and red arrow move back down)
- The 3rd golden cross (green circle) resulted in prices sky rocketing, entering our bull market (green check mark, and green arrow up)
The same sort of fractal may be playing out in 2020:
- I have indicated the same first 2 golden cross failures in 2020
- I have also drawn what appears to be our 3rd upcoming golden cross. So this begs the question: Will we similar price reaction and the start of our new bull market in XRP
Please look at the chart BELOW, and the chart ABOVE and observe the similarities
노트
노트
Potential diamond pattern formationIf it breaks bullish, we will get our 3rd golden cross
노트
If the diamond pattern holds, we could see prices wick above 0.4 as seen with the vertical teal line노트
Diamond pattern was invalidated, but we were in a text book falling wedge which we have since fallen out of it.
Simultaneously, we have a breakout confirmed on our XRPBTC falling wedge
I have a chart on this as well
노트
Weekly View: Positive Divergences shown (blue ascending line) on both the RSI and MACD (RSI since March 20, MACD since Dec 30th of last year)
We may get a large move this week causing our 3rd golden cross on the daily by next week.
노트
We got our daily close above the 200 daily SMANow let's see what happens shortly after the purple line (50 daily SMA) crosses above the pink line (200 daily SMA)
노트
노트
We are about to have our 3rd golden cross since the 2018 bear market (purple 50 daily SMA crossing pink 200 daily SMA)
History doesn't repeat, but often rhymes

Twitter: @CryptoBullGod
Unique Value I add to this space:
youtu.be/YOa3NPEZuC0
Unique Value I add to this space:
youtu.be/YOa3NPEZuC0
면책사항
해당 정보와 게시물은 금융, 투자, 트레이딩 또는 기타 유형의 조언이나 권장 사항으로 간주되지 않으며, 트레이딩뷰에서 제공하거나 보증하는 것이 아닙니다. 자세한 내용은 이용 약관을 참조하세요.
Twitter: @CryptoBullGod
Unique Value I add to this space:
youtu.be/YOa3NPEZuC0
Unique Value I add to this space:
youtu.be/YOa3NPEZuC0
면책사항
해당 정보와 게시물은 금융, 투자, 트레이딩 또는 기타 유형의 조언이나 권장 사항으로 간주되지 않으며, 트레이딩뷰에서 제공하거나 보증하는 것이 아닙니다. 자세한 내용은 이용 약관을 참조하세요.