
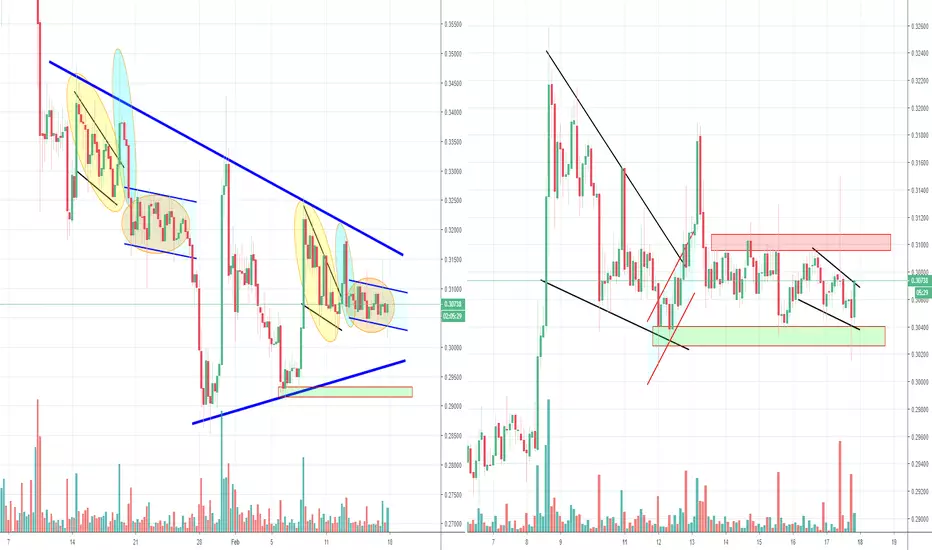
So far XRP' is moving quite identical to the fractal i showed in the previous analysis. We even did that fake breakout (blue circle) and now moving inside of that channel (orange circle).
XRP' is still one of the weakest alts out there, for several weeks already. Based on the fractal, we should see it drop more coming weeks. But i will ignore the fractal for now at this stage. I rather look at the range it's in now, between the red and green zone on the right. A candle close above or below those levels, will probably show us the real direction. That channel on the right could be a first small sign. The big blue triangle on the left seem to be legit as well, which will show us the direction for the coming month or 2 if that one breaks. But for both sides, volume needs to confirm the breakout.
Please don't forget to like if you appreciate this
Previous analysis:
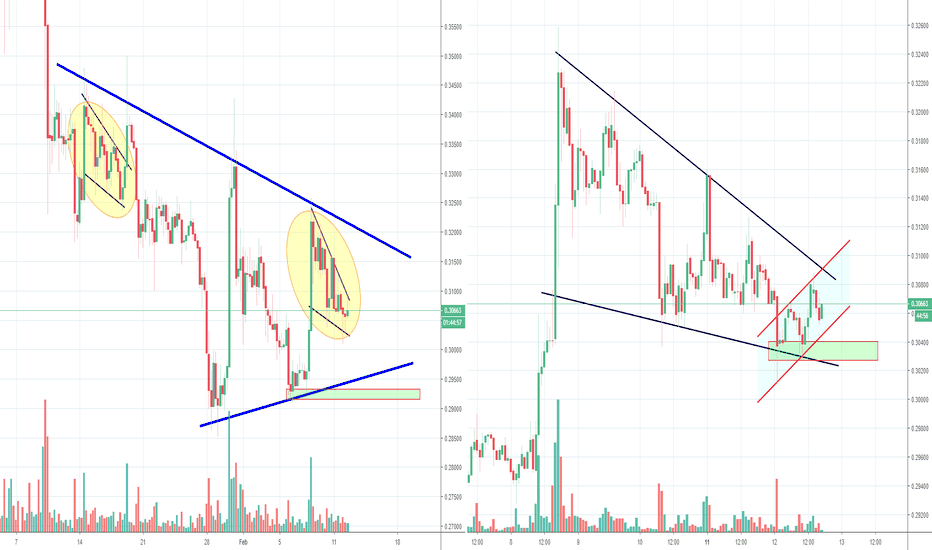
XRP' is still one of the weakest alts out there, for several weeks already. Based on the fractal, we should see it drop more coming weeks. But i will ignore the fractal for now at this stage. I rather look at the range it's in now, between the red and green zone on the right. A candle close above or below those levels, will probably show us the real direction. That channel on the right could be a first small sign. The big blue triangle on the left seem to be legit as well, which will show us the direction for the coming month or 2 if that one breaks. But for both sides, volume needs to confirm the breakout.
Please don't forget to like if you appreciate this
Previous analysis:
노트
XRP bulls really want to make up for lost time it seems, broke that channel on the right and got pumped quite well since. Already against the resistance of that big blue triangle on the left. But this 0.32/0.33 zone wont be an easy one to break though노트
New XRP analysis: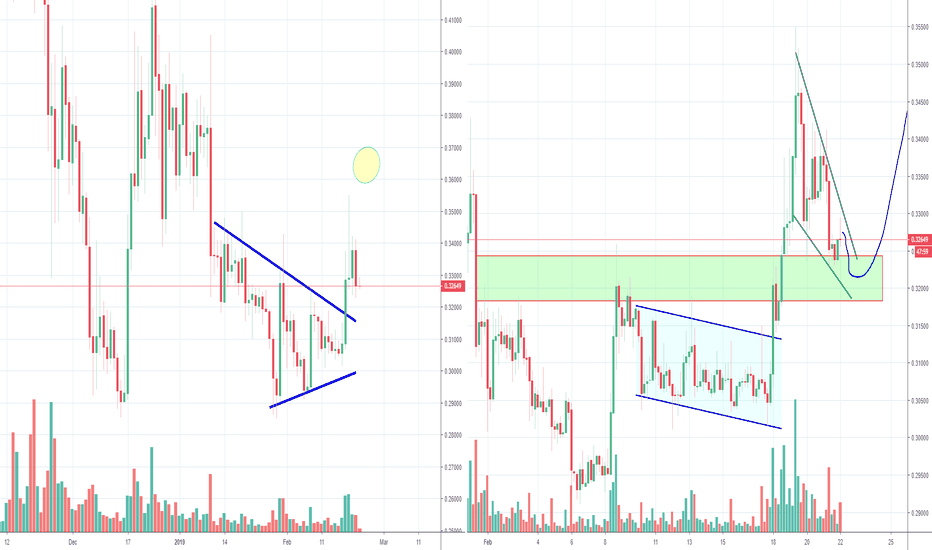

면책사항
해당 정보와 게시물은 금융, 투자, 트레이딩 또는 기타 유형의 조언이나 권장 사항으로 간주되지 않으며, 트레이딩뷰에서 제공하거나 보증하는 것이 아닙니다. 자세한 내용은 이용 약관을 참조하세요.
면책사항
해당 정보와 게시물은 금융, 투자, 트레이딩 또는 기타 유형의 조언이나 권장 사항으로 간주되지 않으며, 트레이딩뷰에서 제공하거나 보증하는 것이 아닙니다. 자세한 내용은 이용 약관을 참조하세요.