
Hello fellow XRP Hopiumers I got some more material for our moon mission xD
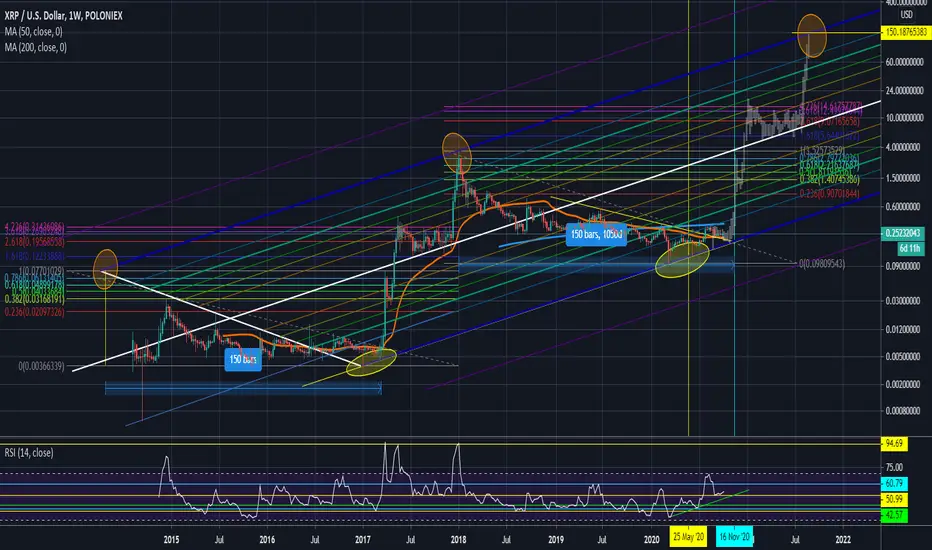
Using a pitchfork, taking the price action from Jan 17 to Jan 18 and the length of previous bear market which was 150 weeks or 1050 days I came to this messy chart.
As of today, 5th October 2020, XRP has done 144 weeks of beark market, so if XRP repeats everything it still has 6~ weeks to go of bear market, so I'm looking at the vertical teal line on 16 Nov 2020 to complete its 150 weeks as it previously did.
So, replicating the price from Jan 17 to Jan 18 would move in the exact same FIB points as before with a final target of $150
Another interesting fact is that XRP macro Elliot 2-3 Wave was 95,000~% ($0.0036 to $3.52) and by this chart the final 4-5 Wave would be 153,000~% or 1.618 ratio ($0.097 to $150).
When moon? lol ...
노트
Trade Active, buckle up fellas ! :)노트
Nailed the timeframe? lol Hope you guys loaded up ! GL All !노트
* Hammer on the daily that almost touched 50d MA
* 0.618 also holding the candle body
* RSI on the daily touched what I think it is a trendline
* Looks like we just did a "spring" event on a Wycoff distribution.
We're going up bois !
노트
Ultimate blue line support held, game ON for XRP.노트
Isnt it nice the price action is moving within the ranges I placed? :DHope u guys didnt sold!

면책사항
해당 정보와 게시물은 금융, 투자, 트레이딩 또는 기타 유형의 조언이나 권장 사항으로 간주되지 않으며, 트레이딩뷰에서 제공하거나 보증하는 것이 아닙니다. 자세한 내용은 이용 약관을 참조하세요.
면책사항
해당 정보와 게시물은 금융, 투자, 트레이딩 또는 기타 유형의 조언이나 권장 사항으로 간주되지 않으며, 트레이딩뷰에서 제공하거나 보증하는 것이 아닙니다. 자세한 내용은 이용 약관을 참조하세요.