
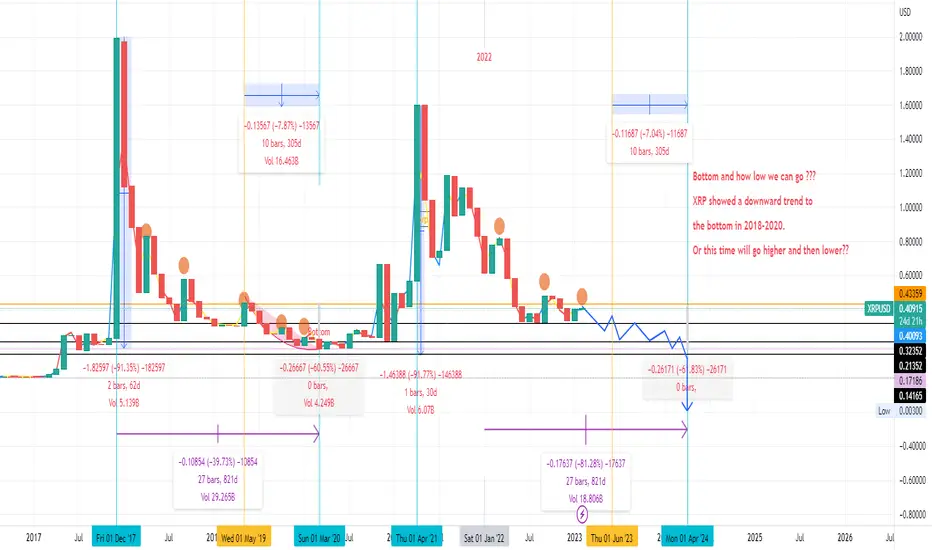
Hello, this chart uses the same constants of 2018 to compare 2023 and shows five waves of lows and much more information,
like charts that showed before the bull run or the pump coming.
XRP showed a downward trend to the bottom in 2018.
I'm not sure if I'm 100% wrong; I just compared the numbers.
Good luck!
like charts that showed before the bull run or the pump coming.
XRP showed a downward trend to the bottom in 2018.
I'm not sure if I'm 100% wrong; I just compared the numbers.
Good luck!

면책사항
해당 정보와 게시물은 금융, 투자, 트레이딩 또는 기타 유형의 조언이나 권장 사항으로 간주되지 않으며, 트레이딩뷰에서 제공하거나 보증하는 것이 아닙니다. 자세한 내용은 이용 약관을 참조하세요.
면책사항
해당 정보와 게시물은 금융, 투자, 트레이딩 또는 기타 유형의 조언이나 권장 사항으로 간주되지 않으며, 트레이딩뷰에서 제공하거나 보증하는 것이 아닙니다. 자세한 내용은 이용 약관을 참조하세요.