
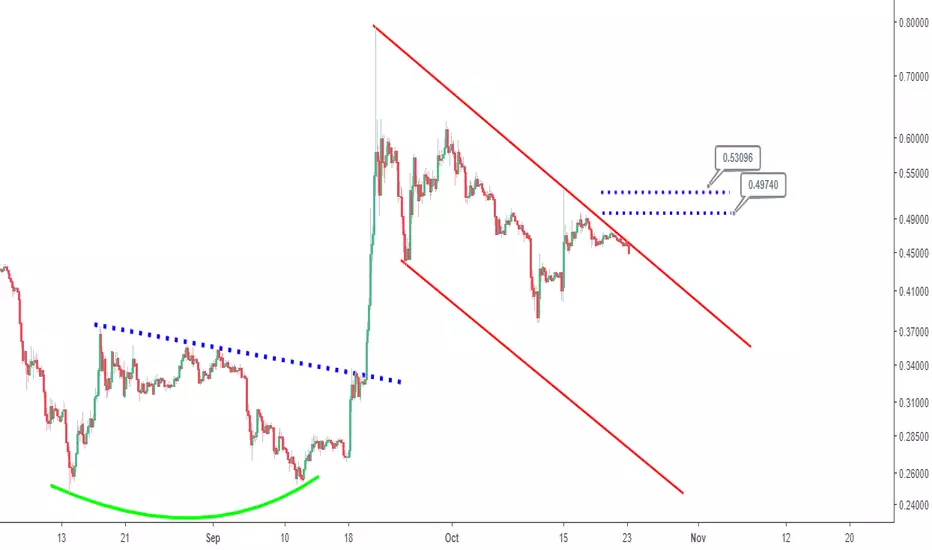
August 14, 2018 to September 20, 2018 marked the formation of a confirmed double bottom chart pattern in Ripple (XRP). Price action after confirmation reached a high of ~$0.79 before the current retracement that is captured with a bearish channel considered to be tentative.
Price action breaking to the upside of the bear channel and also above resistance as indicated by the horizontal blue lines does argue for a bullish bias for Ripple (XRP).
Price action breaking to the upside of the bear channel and also above resistance as indicated by the horizontal blue lines does argue for a bullish bias for Ripple (XRP).

관련 발행물
면책사항
해당 정보와 게시물은 금융, 투자, 트레이딩 또는 기타 유형의 조언이나 권장 사항으로 간주되지 않으며, 트레이딩뷰에서 제공하거나 보증하는 것이 아닙니다. 자세한 내용은 이용 약관을 참조하세요.
관련 발행물
면책사항
해당 정보와 게시물은 금융, 투자, 트레이딩 또는 기타 유형의 조언이나 권장 사항으로 간주되지 않으며, 트레이딩뷰에서 제공하거나 보증하는 것이 아닙니다. 자세한 내용은 이용 약관을 참조하세요.