
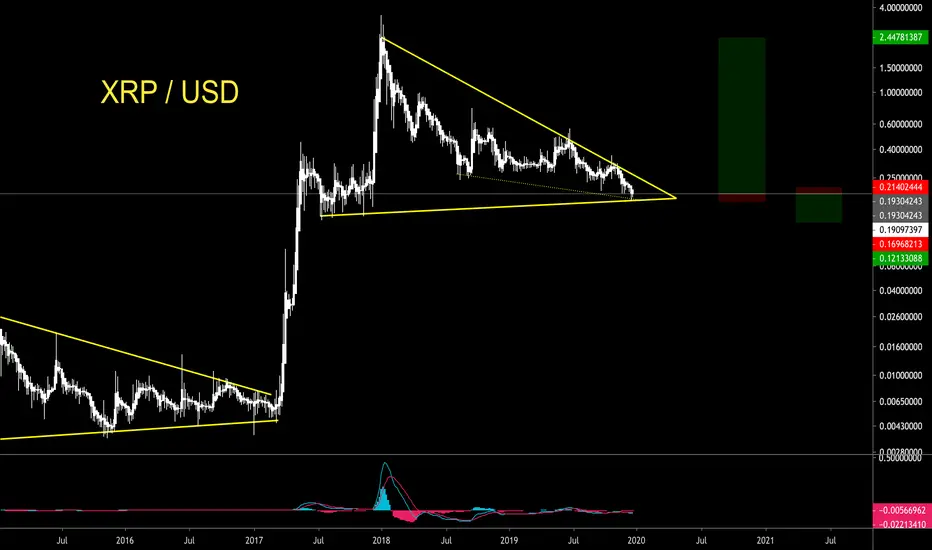
XRP / USD TA
Here we are looking at Symmetrical Triangle Chart Pattern which are usually bullish when seen in a general upward trend which is what we hav here. Usually you can expect a measured move towards the upside in a 2 wave sequence.
Bearish outlook is also in if we break through this pattern and support we will most likely drop towards 12 - 14 cent ranges.
Holders should not sell while traders should hedge their positions around here.
Here we are looking at Symmetrical Triangle Chart Pattern which are usually bullish when seen in a general upward trend which is what we hav here. Usually you can expect a measured move towards the upside in a 2 wave sequence.
Bearish outlook is also in if we break through this pattern and support we will most likely drop towards 12 - 14 cent ranges.
Holders should not sell while traders should hedge their positions around here.

관련 발행물
면책사항
해당 정보와 게시물은 금융, 투자, 트레이딩 또는 기타 유형의 조언이나 권장 사항으로 간주되지 않으며, 트레이딩뷰에서 제공하거나 보증하는 것이 아닙니다. 자세한 내용은 이용 약관을 참조하세요.
관련 발행물
면책사항
해당 정보와 게시물은 금융, 투자, 트레이딩 또는 기타 유형의 조언이나 권장 사항으로 간주되지 않으며, 트레이딩뷰에서 제공하거나 보증하는 것이 아닙니다. 자세한 내용은 이용 약관을 참조하세요.