
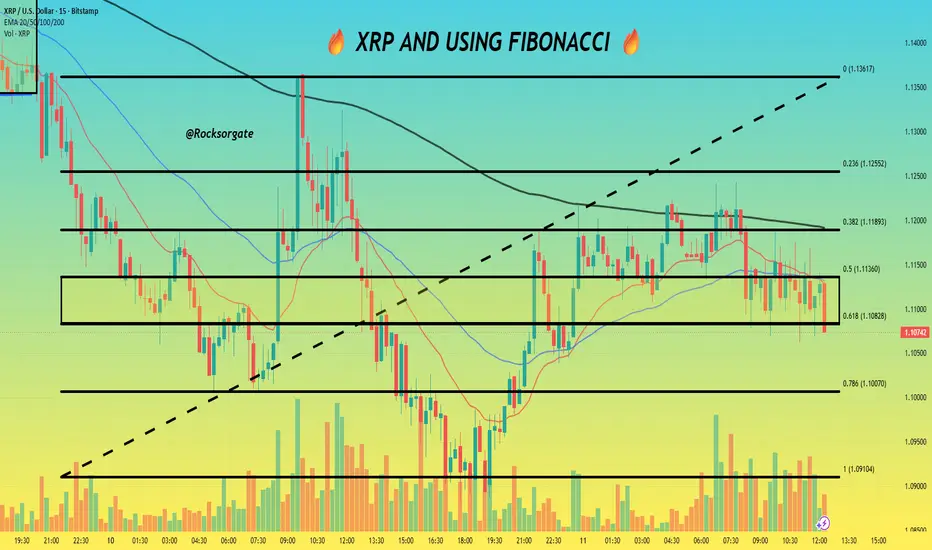
🔥 Good afternoon, may these words find you well. It's a nice day and I intend on enjoying it, so let's keep this idea short and focus on a local technical analysis using our Fibonacci Retracement Levels today.
🔥 Before I continue, for anyone new to what the Fibonacci Retracement Levels are used for I'll give a quick explanation: Using the Fibonacci Retracement Levels helps most traders identify key support and resistance levels during market pullbacks, much like the current one XRP and most of the market is in. By plotting the mathematical ratio's on the chart we can pinpoint potential zones of resistance or support. This also helps identify price targets based on further expected reversals or using trader psychology but that's for another day.
🔥 In short form, they help us identify key levels of support and resistance. So definitely keep this chart noted for future reference and some important levels.
🔥 Now back to our technical analysis we have XRP hovering around $1.11 after a bumpy few weeks in which we've seen it move below the 200-day moving average. Price aside the Utility is still very much real, the network is still showing high transaction counts and burn rates cementing it's continued use case for cheap cross-border payments and more functions in the financial world.
🔥 Technical Analysis 🔥
🔥 Currently we're below the 200-day moving average so bears have the upper hand but our friend here will be this horizontal level I've highlighted between $1.08 and $1.11. At the moment this is our pivot point, can see off past price action where we fell and rose based on this channel and which way we exit or enter.
🔥 Keep noted of the channel and that 200-moving day average. We already know we're just looking to hold support above $1.08 and regain that 200 EMA which will have to happen again sooner or later.
🔥 Need to go work on some other things but wanted to get a quick post up for you guys, after all, the market never stops for anyone! We simply move with it best we can. Thanks for everything and all the best till next.
~ Rock '
🔥 Before I continue, for anyone new to what the Fibonacci Retracement Levels are used for I'll give a quick explanation: Using the Fibonacci Retracement Levels helps most traders identify key support and resistance levels during market pullbacks, much like the current one XRP and most of the market is in. By plotting the mathematical ratio's on the chart we can pinpoint potential zones of resistance or support. This also helps identify price targets based on further expected reversals or using trader psychology but that's for another day.
🔥 In short form, they help us identify key levels of support and resistance. So definitely keep this chart noted for future reference and some important levels.
🔥 Now back to our technical analysis we have XRP hovering around $1.11 after a bumpy few weeks in which we've seen it move below the 200-day moving average. Price aside the Utility is still very much real, the network is still showing high transaction counts and burn rates cementing it's continued use case for cheap cross-border payments and more functions in the financial world.
🔥 Technical Analysis 🔥
🔥 Currently we're below the 200-day moving average so bears have the upper hand but our friend here will be this horizontal level I've highlighted between $1.08 and $1.11. At the moment this is our pivot point, can see off past price action where we fell and rose based on this channel and which way we exit or enter.
🔥 Keep noted of the channel and that 200-moving day average. We already know we're just looking to hold support above $1.08 and regain that 200 EMA which will have to happen again sooner or later.
🔥 Need to go work on some other things but wanted to get a quick post up for you guys, after all, the market never stops for anyone! We simply move with it best we can. Thanks for everything and all the best till next.
~ Rock '

관련 발행물
면책사항
해당 정보와 게시물은 금융, 투자, 트레이딩 또는 기타 유형의 조언이나 권장 사항으로 간주되지 않으며, 트레이딩뷰에서 제공하거나 보증하는 것이 아닙니다. 자세한 내용은 이용 약관을 참조하세요.
면책사항
해당 정보와 게시물은 금융, 투자, 트레이딩 또는 기타 유형의 조언이나 권장 사항으로 간주되지 않으며, 트레이딩뷰에서 제공하거나 보증하는 것이 아닙니다. 자세한 내용은 이용 약관을 참조하세요.