
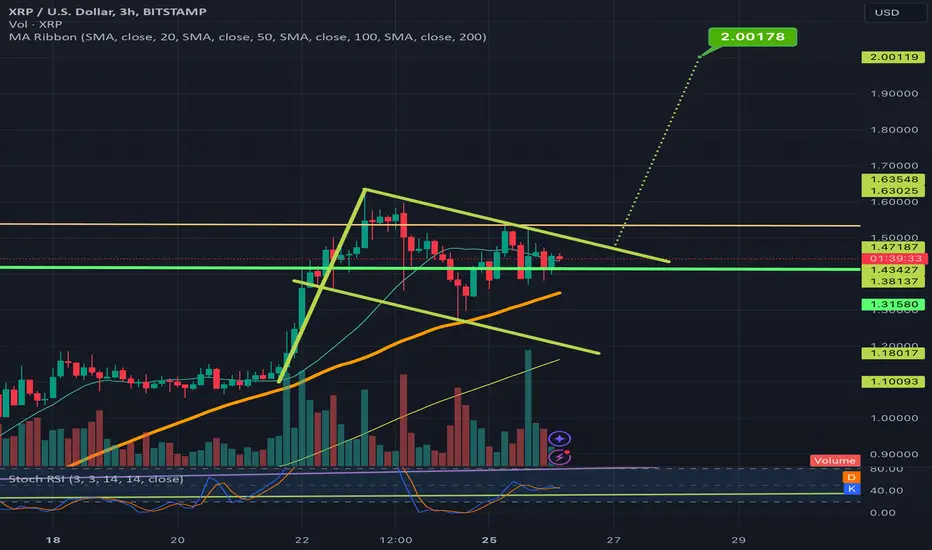
A rare look by me at the 3 hour timeframe chart on XRPUSD. I normally don’t try to chart timeframes lower than 1 day because the chart patterns have a much lower success rate of reaching their full breakout targets. However I noticed that the 3 hour charts 50ma (in orange) has held as support since November 5th and is getting close to climbing its way up out of the bullflag here. If price continues to maintain solidified support on that 50ma, then it will validate the breakout up from this bullflag in the near future which will have a breakout target of around $2.00 . Of course being a small time frame, the 3hr 50ma could also easily flip back to resistance in which case we wouldn’t validate the breakout. For now probability favors the breakout upward slightly moreso. *not financial advice*
노트
3hr ma has at least temporarily flipped to resistance here, however the 4hr 50ma is still holding support. 노트
4hr 50ma held support and 3hr 50ma is back to acting as support for now.노트
As originally anticipated the 4hr 50ma appears to be shoving price acton up out of the flag now that it has flipped back to support. 노트
An updated look at the 3hpur 50ma: 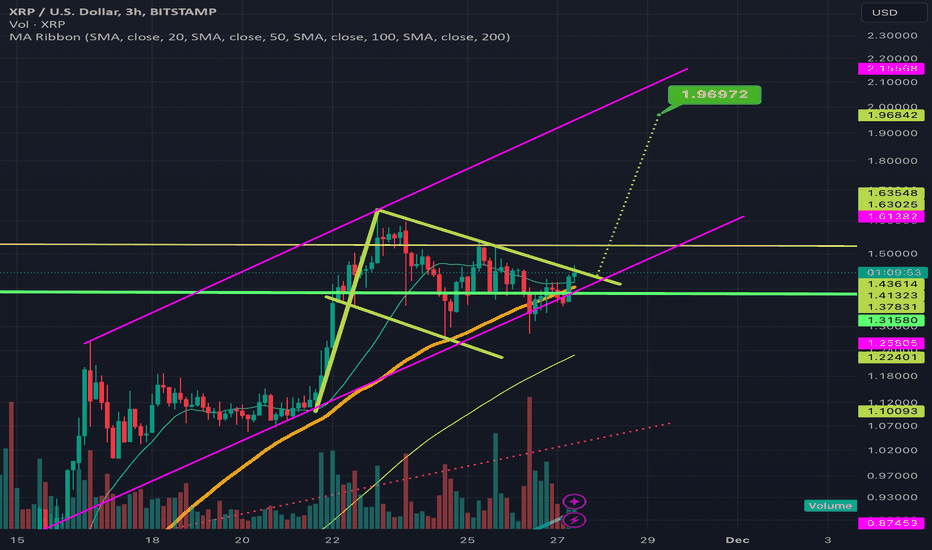
거래청산: 타겟 닿음
Target hit!
면책사항
해당 정보와 게시물은 금융, 투자, 트레이딩 또는 기타 유형의 조언이나 권장 사항으로 간주되지 않으며, 트레이딩뷰에서 제공하거나 보증하는 것이 아닙니다. 자세한 내용은 이용 약관을 참조하세요.
면책사항
해당 정보와 게시물은 금융, 투자, 트레이딩 또는 기타 유형의 조언이나 권장 사항으로 간주되지 않으며, 트레이딩뷰에서 제공하거나 보증하는 것이 아닙니다. 자세한 내용은 이용 약관을 참조하세요.