
Hey Trader!
Is now the right time to buy some XRP? Let’s take a closer look.
XRP/USDT - Symmetrical Triangle Suggests a Breakout Is Coming
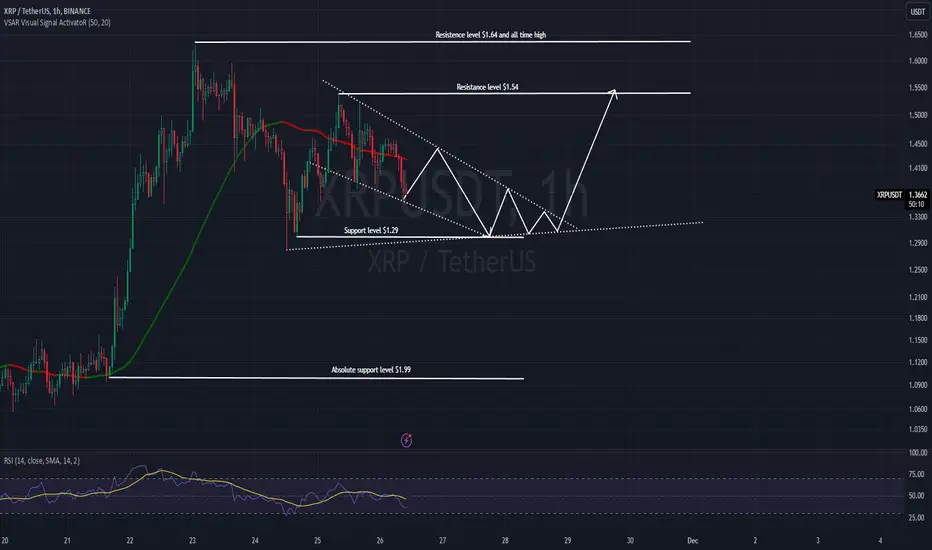
XRP/USDT is currently consolidating within a symmetrical triangle on the 1-hour chart—a classic pattern that reflects market indecision and often signals an impending breakout. The price is trading between critical support at $1.29 and resistance at $1.54, with a broader resistance level at $1.64, representing a recent high. This phase of consolidation suggests the market is gearing up for a decisive move, either up or down.
The Relative Strength Index (RSI) is currently at 36.96, indicating bearish momentum but approaching oversold territory. If the RSI dips below 30, it could signal that sellers are losing strength, increasing the likelihood of a rebound. However, for a stronger bullish case, the RSI would need to rise above 50, as bearish sentiment still dominates for now.
From a technical standpoint, a bullish breakout would occur if the price pushes above the triangle’s upper boundary and clears the $1.54 resistance. This could pave the way for a move toward $1.64 or higher. Conversely, a bearish breakdown below the $1.29 support would confirm sellers' dominance, potentially triggering a drop to lower levels.
This symmetrical triangle highlights a period of consolidation and mounting tension, with a breakout imminent. Traders should pay close attention to the direction of the breakout to position themselves accordingly.
Will the bulls regain control and push XRP higher, or will the bears take the upper hand? Stay tuned—this is a setup you don’t want to miss! 🚀📉
Is now the right time to buy some XRP? Let’s take a closer look.
XRP/USDT - Symmetrical Triangle Suggests a Breakout Is Coming
XRP/USDT is currently consolidating within a symmetrical triangle on the 1-hour chart—a classic pattern that reflects market indecision and often signals an impending breakout. The price is trading between critical support at $1.29 and resistance at $1.54, with a broader resistance level at $1.64, representing a recent high. This phase of consolidation suggests the market is gearing up for a decisive move, either up or down.
The Relative Strength Index (RSI) is currently at 36.96, indicating bearish momentum but approaching oversold territory. If the RSI dips below 30, it could signal that sellers are losing strength, increasing the likelihood of a rebound. However, for a stronger bullish case, the RSI would need to rise above 50, as bearish sentiment still dominates for now.
From a technical standpoint, a bullish breakout would occur if the price pushes above the triangle’s upper boundary and clears the $1.54 resistance. This could pave the way for a move toward $1.64 or higher. Conversely, a bearish breakdown below the $1.29 support would confirm sellers' dominance, potentially triggering a drop to lower levels.
This symmetrical triangle highlights a period of consolidation and mounting tension, with a breakout imminent. Traders should pay close attention to the direction of the breakout to position themselves accordingly.
Will the bulls regain control and push XRP higher, or will the bears take the upper hand? Stay tuned—this is a setup you don’t want to miss! 🚀📉

면책사항
해당 정보와 게시물은 금융, 투자, 트레이딩 또는 기타 유형의 조언이나 권장 사항으로 간주되지 않으며, 트레이딩뷰에서 제공하거나 보증하는 것이 아닙니다. 자세한 내용은 이용 약관을 참조하세요.
면책사항
해당 정보와 게시물은 금융, 투자, 트레이딩 또는 기타 유형의 조언이나 권장 사항으로 간주되지 않으며, 트레이딩뷰에서 제공하거나 보증하는 것이 아닙니다. 자세한 내용은 이용 약관을 참조하세요.