
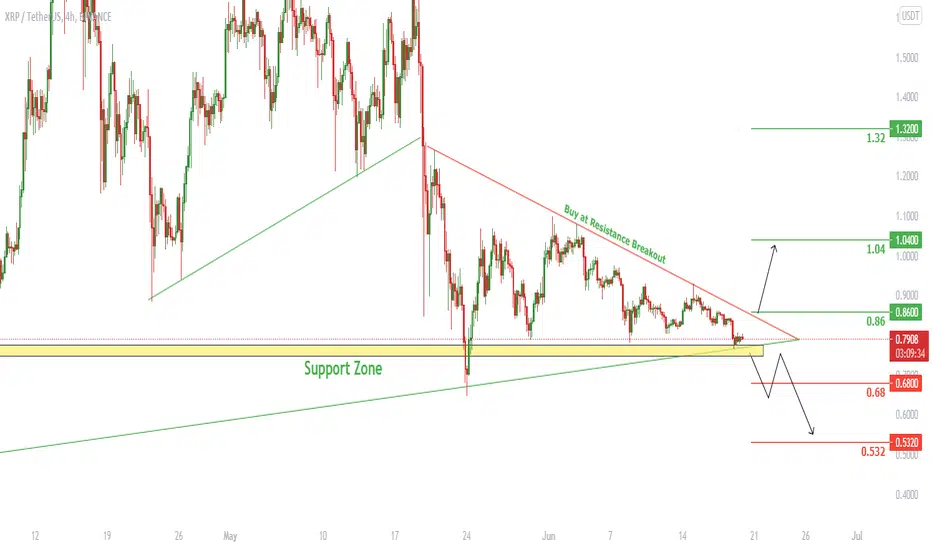
So here on XRPUSDT the price has formed a descending Triangle at the Support zone and has got 3 rejections. It is expected that the prices breaks above the Resistance line and goes higher up to 1.04
If the breakout happened at the lower time frame we need to see the candlestick patterns and if we see a Bullish pattern we can go long.
However if it breaks below the Support then after a Pullback it's expected to go lower down to 0.532
Have a Profitable Day
If you find this helpful and want more FREE forecasts in TradingView
Please show your support back,
Hit the 👍 LIKE button,
Drop some feedback below in the comment!
❤️ Your Support is really appreciated!❤️

면책사항
해당 정보와 게시물은 금융, 투자, 트레이딩 또는 기타 유형의 조언이나 권장 사항으로 간주되지 않으며, 트레이딩뷰에서 제공하거나 보증하는 것이 아닙니다. 자세한 내용은 이용 약관을 참조하세요.
면책사항
해당 정보와 게시물은 금융, 투자, 트레이딩 또는 기타 유형의 조언이나 권장 사항으로 간주되지 않으며, 트레이딩뷰에서 제공하거나 보증하는 것이 아닙니다. 자세한 내용은 이용 약관을 참조하세요.