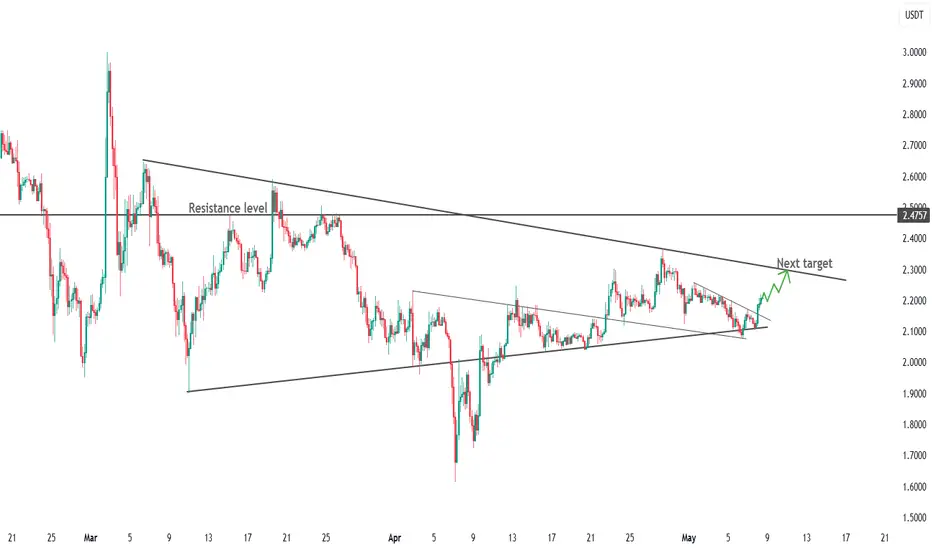
 XRP - bulls attack triangle, focus on 2.30 → 2.48 USDT
Price has been holding above the ascending support since mid-March and has just popped out of a local falling wedge, keeping the chance of a breakout of the main downtrend line alive.
📌 Levels
- S1 2.10 USDT - dynamic support and bottom of the small wedge
- S2 2.00 USDT - round number and bottom of the broad pattern
- R1 2,30 USDT - crossing of the downtrend line (target #1)
- R2 2,48 USDT - horizontal “Resistance level”, potential reversal boundary
📈 Scenario
A consolidation above 2.30 will confirm the bullish exit from the triangle and open the way to 2.48 USDT. A breakout to 2.60 is possible if volume strengthens.
⚠️ Risks
A failure below 2.10 will bring the price back to the narrowing range; a move below 2.00 will increase sellers' pressure and target 1.90-1.85 USDT.

면책사항
해당 정보와 게시물은 금융, 투자, 트레이딩 또는 기타 유형의 조언이나 권장 사항으로 간주되지 않으며, 트레이딩뷰에서 제공하거나 보증하는 것이 아닙니다. 자세한 내용은 이용 약관을 참조하세요.
면책사항
해당 정보와 게시물은 금융, 투자, 트레이딩 또는 기타 유형의 조언이나 권장 사항으로 간주되지 않으며, 트레이딩뷰에서 제공하거나 보증하는 것이 아닙니다. 자세한 내용은 이용 약관을 참조하세요.