Long
✳️ Tezos Candlestick Pattern Confirms Bottom (500% Or More)
Join me, let's start with candlestick reading.
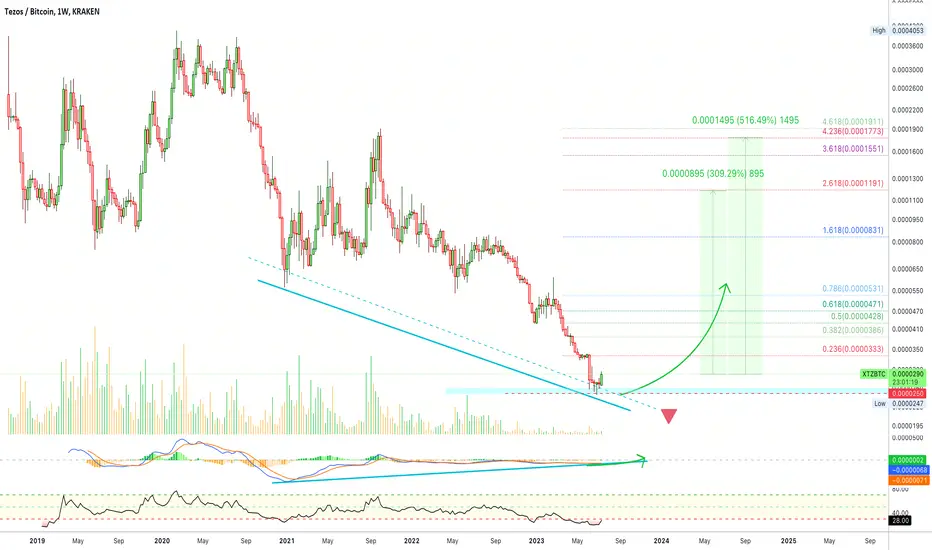
Tezos (XTZBTC) Weekly Chart

We have two candles to look at in this chart.
1) Following a strong drop, high bear volume, we get a Hammer (26-June). It produces a lower low compared to early June but the volume is lower and the candlestick closes green. All this combined can be read as a reversal signal.
2) This week we have a full green candle with the highest volume since February and trading above the four previous candles high/close. This candle confirms the reversal signal we got from the hammer.
That's it.
You can also see a young bullish cross on the MACD, with bullish divergence on the histogram turned green:
And the RSI hitting a new All-Time Low.
I don't know if Tezos will increase in price but the chart is saying up.
The potential can vary... Medium-term 300%, long-term much more.
Additional details on the chart.
Namaste.
Tezos (XTZBTC) Weekly Chart
We have two candles to look at in this chart.
1) Following a strong drop, high bear volume, we get a Hammer (26-June). It produces a lower low compared to early June but the volume is lower and the candlestick closes green. All this combined can be read as a reversal signal.
2) This week we have a full green candle with the highest volume since February and trading above the four previous candles high/close. This candle confirms the reversal signal we got from the hammer.
That's it.
You can also see a young bullish cross on the MACD, with bullish divergence on the histogram turned green:
And the RSI hitting a new All-Time Low.
I don't know if Tezos will increase in price but the chart is saying up.
The potential can vary... Medium-term 300%, long-term much more.
Additional details on the chart.
Namaste.

Trading Cryptocurrencies can be the hardest undertaking ever without the right trade-numbers, without accurate private-access information. Free is free, but the best always requires sweat, an investment. Since 2017 👇
t.me/masteranandatrades/8778
t.me/masteranandatrades/8778
관련 발행물
면책사항
해당 정보와 게시물은 금융, 투자, 트레이딩 또는 기타 유형의 조언이나 권장 사항으로 간주되지 않으며, 트레이딩뷰에서 제공하거나 보증하는 것이 아닙니다. 자세한 내용은 이용 약관을 참조하세요.
Trading Cryptocurrencies can be the hardest undertaking ever without the right trade-numbers, without accurate private-access information. Free is free, but the best always requires sweat, an investment. Since 2017 👇
t.me/masteranandatrades/8778
t.me/masteranandatrades/8778
관련 발행물
면책사항
해당 정보와 게시물은 금융, 투자, 트레이딩 또는 기타 유형의 조언이나 권장 사항으로 간주되지 않으며, 트레이딩뷰에서 제공하거나 보증하는 것이 아닙니다. 자세한 내용은 이용 약관을 참조하세요.